
Advertisement
Advertisement
Gold Price Futures (GC) Technical Analysis – Late Session Short-Covering Rally Could Target $1889.80
By:
The direction of the February Comex gold market into the close on Tuesday will likely be determined by trader reaction to the 50% level at $1864.90.

In this article:
Gold futures are inching higher late in the session on Tuesday as a weaker U.S. Dollar drove up foreign demand just enough to underpin the dollar-denominated asset. Prices could rise further into the close because March 10-year Treasury notes have reversed to the upside and are currently in a position to close higher for the session. For those who don’t know Treasurys have an inverse relationship with yields so this means yields are falling today.
At 18:21, February Comex gold futures are trading $1852.00, up $1.20 or 0.06%.
Earlier in the session, gold prices eased in choppy trading that earlier saw it climb as much as 1% as a surge in U.S. Treasury yields outweighed support from bets on higher inflation as Washington rolls out more stimulus.
Daily Swing Chart Technical Analysis
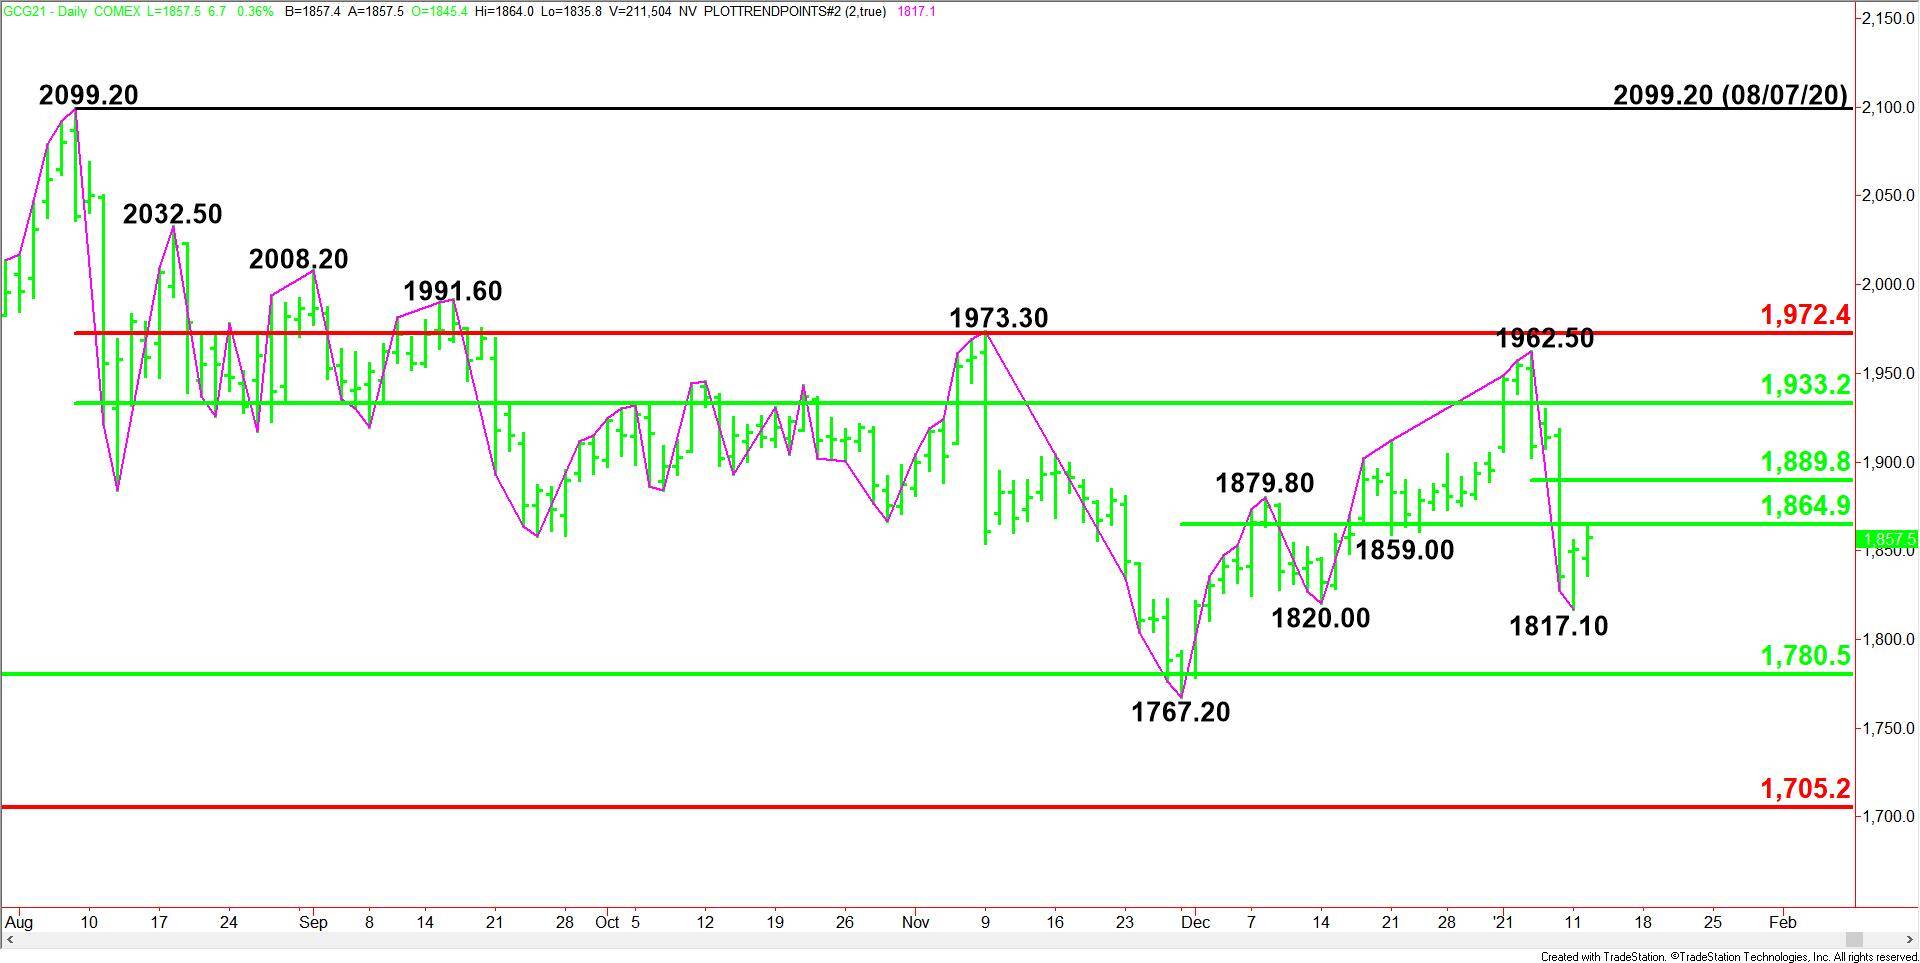
The main trend is down according to the daily swing chart. However, Monday’s closing price reversal bottom and today’s subsequent confirmation suggests momentum may be shifting to the upside at least temporarily.
The main trend will change to up on a move through $1962.50, while a trade through $1817.10 will negate the closing price reversal bottom and signal a resumption of the downtrend.
The short-term range is $1767.20 to $1962.50. Its 50% level at $1864.90 is providing resistance today.
The new minor range is $1962.50 to $1817.10. Its 50% level at $1889.80 is the next potential upside target.
The major upside target is $1933.20 to $1972.40.
The major downside target and long-term support zone is $1780.50 to $1705.20.
Daily Swing Chart Technical Forecast
The direction of the February Comex gold market into the close on Tuesday will likely be determined by trader reaction to the 50% level at $1864.90.
Bullish Scenario
A sustained move over $1864.90 will indicate the presence of buyers. This could trigger a surge into our first objective at $1889.80. Since the main trend is down, sellers are likely to come in on a test of this level. They are going to try to form a secondary lower top.
Overtaking $1889.80, however, will indicate the buying is getting stronger.
Bearish Scenario
A sustained move under $1864.90 will signal the presence of sellers. This could trigger a retest of the minor bottom at $1817.10. If it fails then look for the selling to possibly extend into the long-term 50% level at $1780.50.
For a look at all of today’s economic events, check out our economic calendar.
About the Author
James Hyerczykauthor
James is a Florida-based technical analyst, market researcher, educator and trader with 35+ years of experience. He is an expert in the area of patterns, price and time analysis as it applies to futures, Forex, and stocks.
Did you find this article useful?
Latest news and analysis


Advertisement