
Advertisement
Advertisement
EOS, Stellar’s Lumen, and Tron’s TRX – Daily Analysis – January 18th, 2021
By:
It's a mixed start to the day. Avoiding the day's pivot levels would bring resistance levels into play.

In this article:
EOS
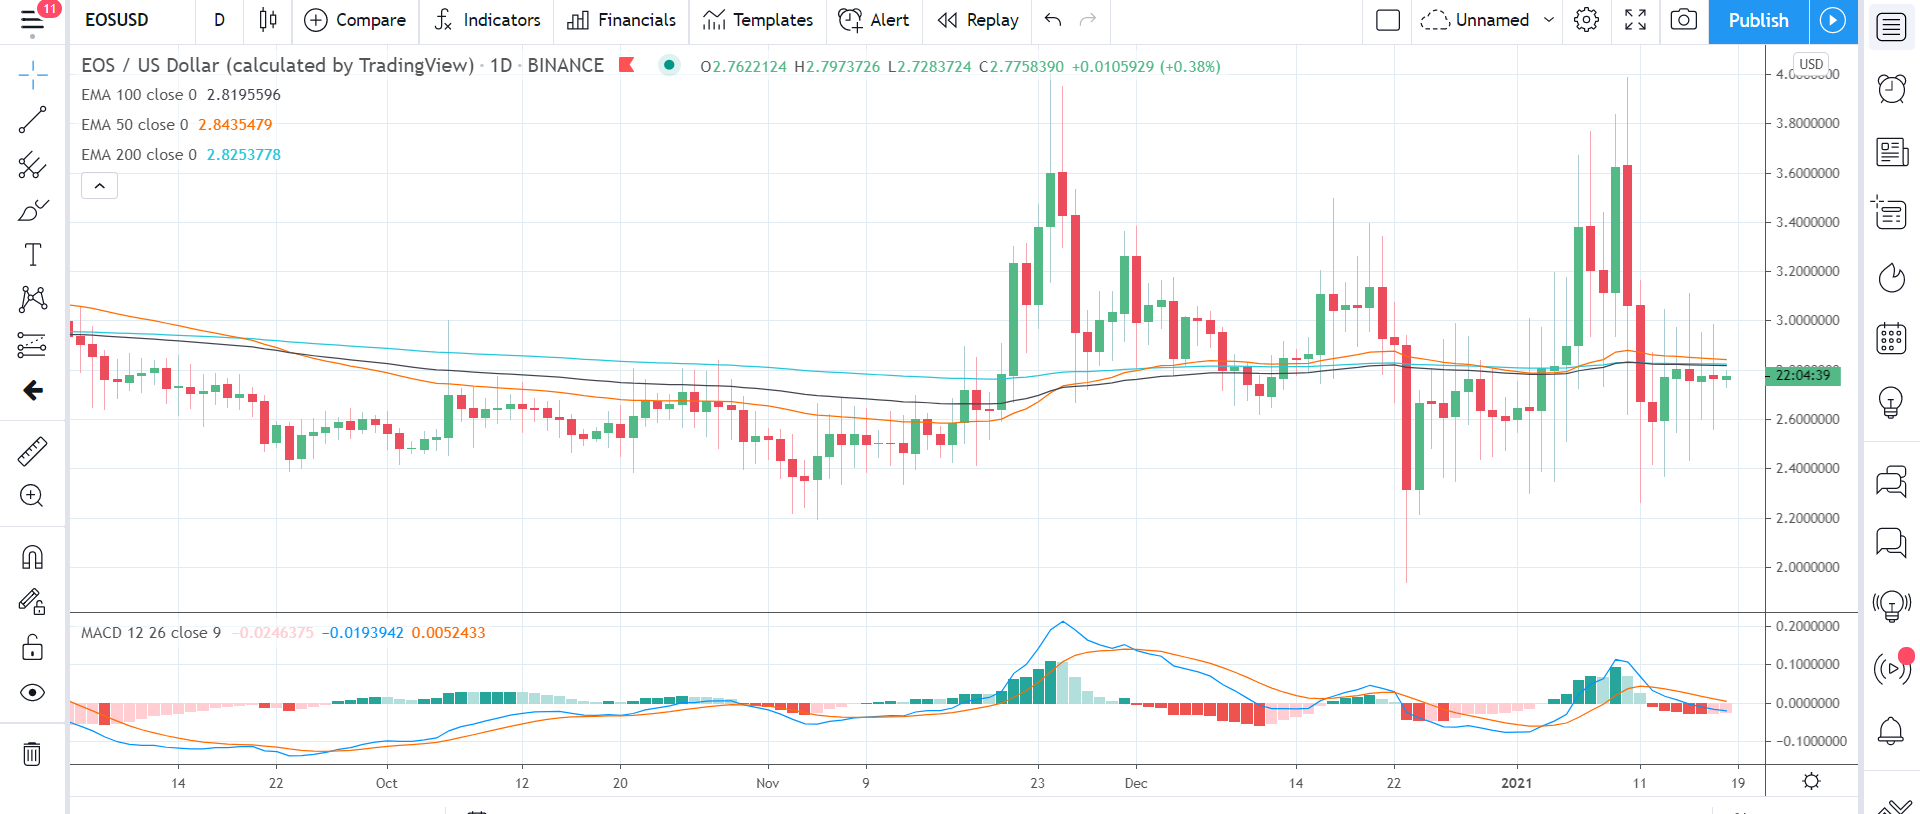
EOS fell by 0.54% on Sunday. Partially reversing a 0.76% gain from Saturday, EOS ended the week down by 9.65% to $2.7653.
A mixed start to the day saw EOS rise to an early morning intraday high $2.8194 before hitting reverse.
Falling short of the first major resistance level at $2.8858, EOS slid to a late morning intraday low $2.6593.
EOS fell through first major support level at $2.6812 before a break back through to $2.81 levels.
A bearish end to the day, however, saw EOS fall back through to sub-$2.78 levels to end the day in the red.
At the time of writing, EOS was down by 0.36% to $2.7610. A mixed start to the day saw EOS rise to an early morning high $2.8297 before falling to a low $2.7335.
EOS left the major support and resistance levels untested early on.
For the day ahead
EOS would need to avoid a fall back through the $2.7480 pivot level to support a run at the first major resistance level at $2.8367.
Support from the broader market would be needed, however, for EOS to break out from Sunday’s high $2.8194.
Barring an extended crypto rally, the first major resistance level and resistance at $2.85 would likely cap any upside.
In the event of an extended rally, EOS could test resistance at $3.00 before any pullback. The second major resistance level sits at $2.9081.
Failure to avoid a fall back through the pivot level at $2.7480 would bring the first major support level at $2.6766 into play.
Barring an extended sell-off, however, EOS should steer of sub-$2.60 levels, however. The second major support level sits at $2.5879.
Looking at the Technical Indicators
First Major Support Level: $2.6766
First Major resistance Level: $2.8367
23.6% FIB Retracement Level: $6.52
38% FIB Retracement Level: $9.68
62% FIB Retracement Level: $14.77
Stellar’s Lumen
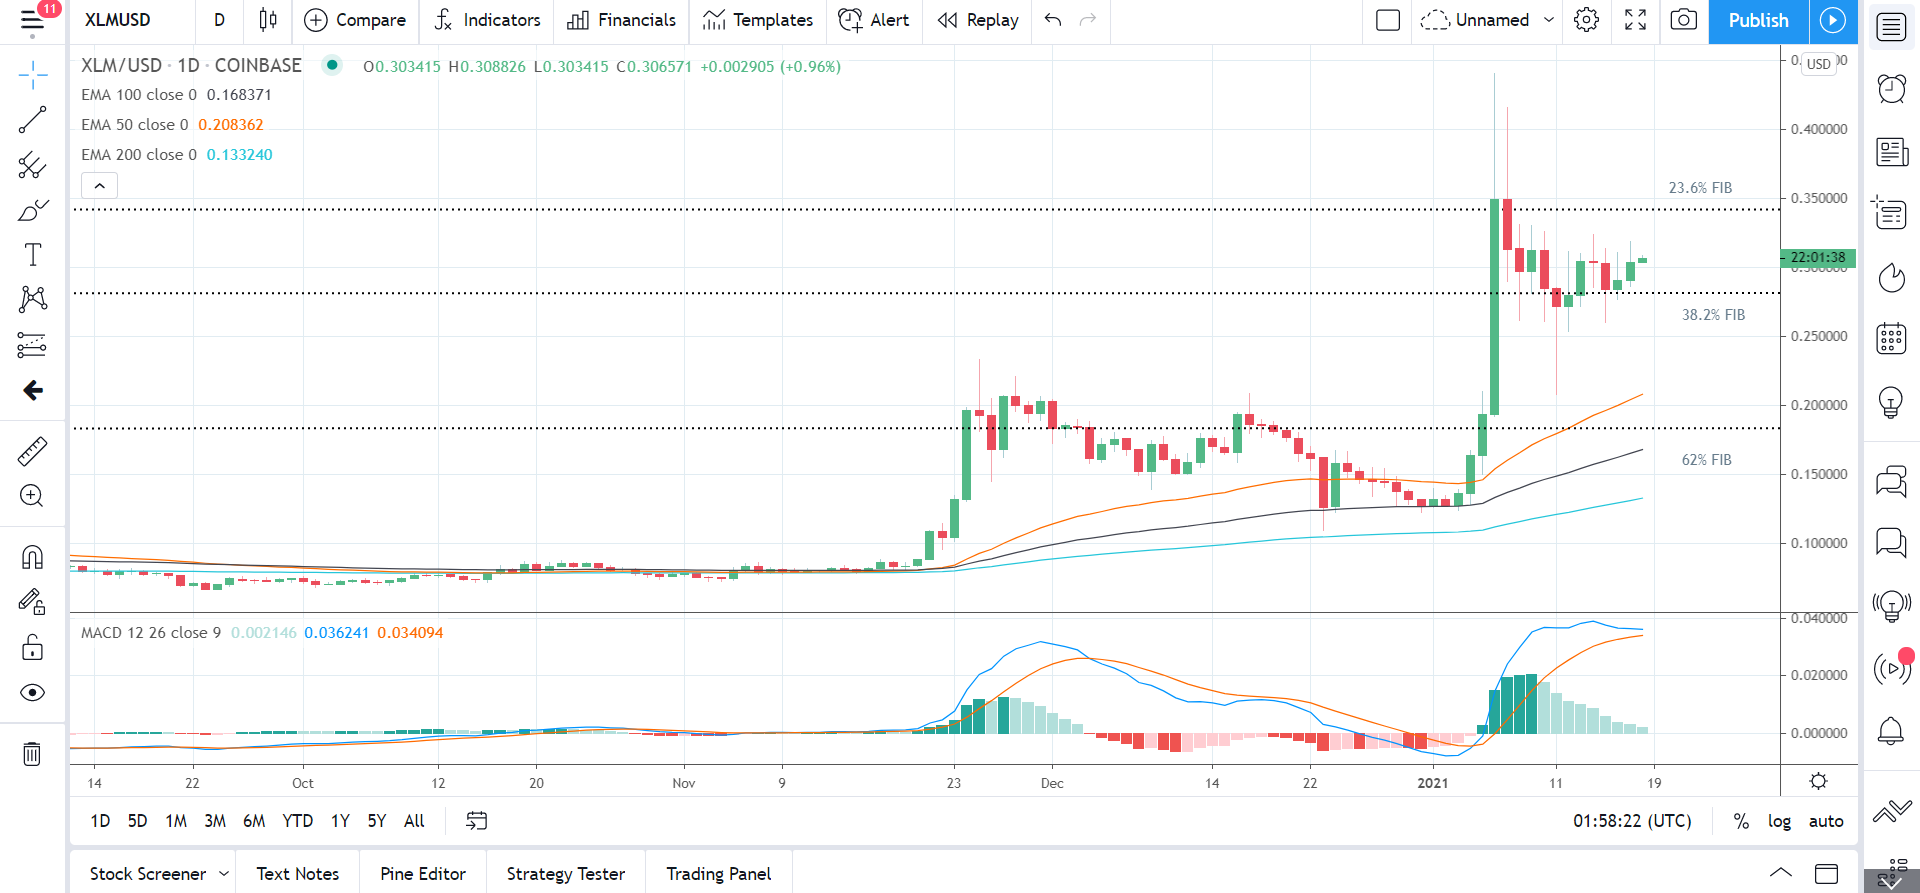
Stellar’s Lumen rallied by 4.47% on Sunday. Following on from a 2.39% gain on Saturday, Stellar’s Lumen ended the week up by 6.64% to $0.3037.
A mixed start to the day saw Stellar’s Lumen fall to an early morning intraday low $0.2861 before making a move.
Steering clear of the first major support level at $0.2748, Stellar’s Lumen rallied to an early morning intraday high $0.3190.
Stellar’s Lumen broke through the first major resistance level at $0.3089 before a slide back to sub-$0.29 levels.
Finding late support, however, Stellar’s Lumen moved back through to $0.30 levels to end the day in the green.
At the time of writing, Stellar’s Lumen was up by 0.96% to $0.3066. A bullish start to the day saw Stellar’s Lumen rise from an early morning low $0.3034 to a high $0.3088.
Stellar’s Lumen left the major support and resistance levels untested early on.
For the day ahead
Stellar’s Lumen would need to avoid a fall through the $0.3029 pivot to bring the first major resistance level at $0.3198 into play.
Support from the broader market would be needed, however, for Stellar’s Lumen to break back through to $0.31 levels.
Barring an extended crypto rally, the first major resistance level and Sunday’s high $0.3190 would likely cap any upside.
In the event of an extended rally, Stellar’s Lumen could test resistance at $0.33 before any pullback. The second major resistance level sits at $0.3358.
Failure to avoid a fall through the $0.0.3029 pivot would bring the first major support level at $0.2869 and 38.2% FIB of $0.2823 into play.
Barring another extended crypto sell-off, however, Stellar’s Lumen should steer clear of sub-$0.028 levels. The second major support level sits at $0.2701.
Looking at the Technical Indicators
First Major Support Level: $0.2869
First Major Resistance Level: $0.3198
23.6% FIB Retracement Level: $0.3187
38% FIB Retracement Level: $0.2823
62% FIB Retracement Level: $0.1850
Tron’s TRX
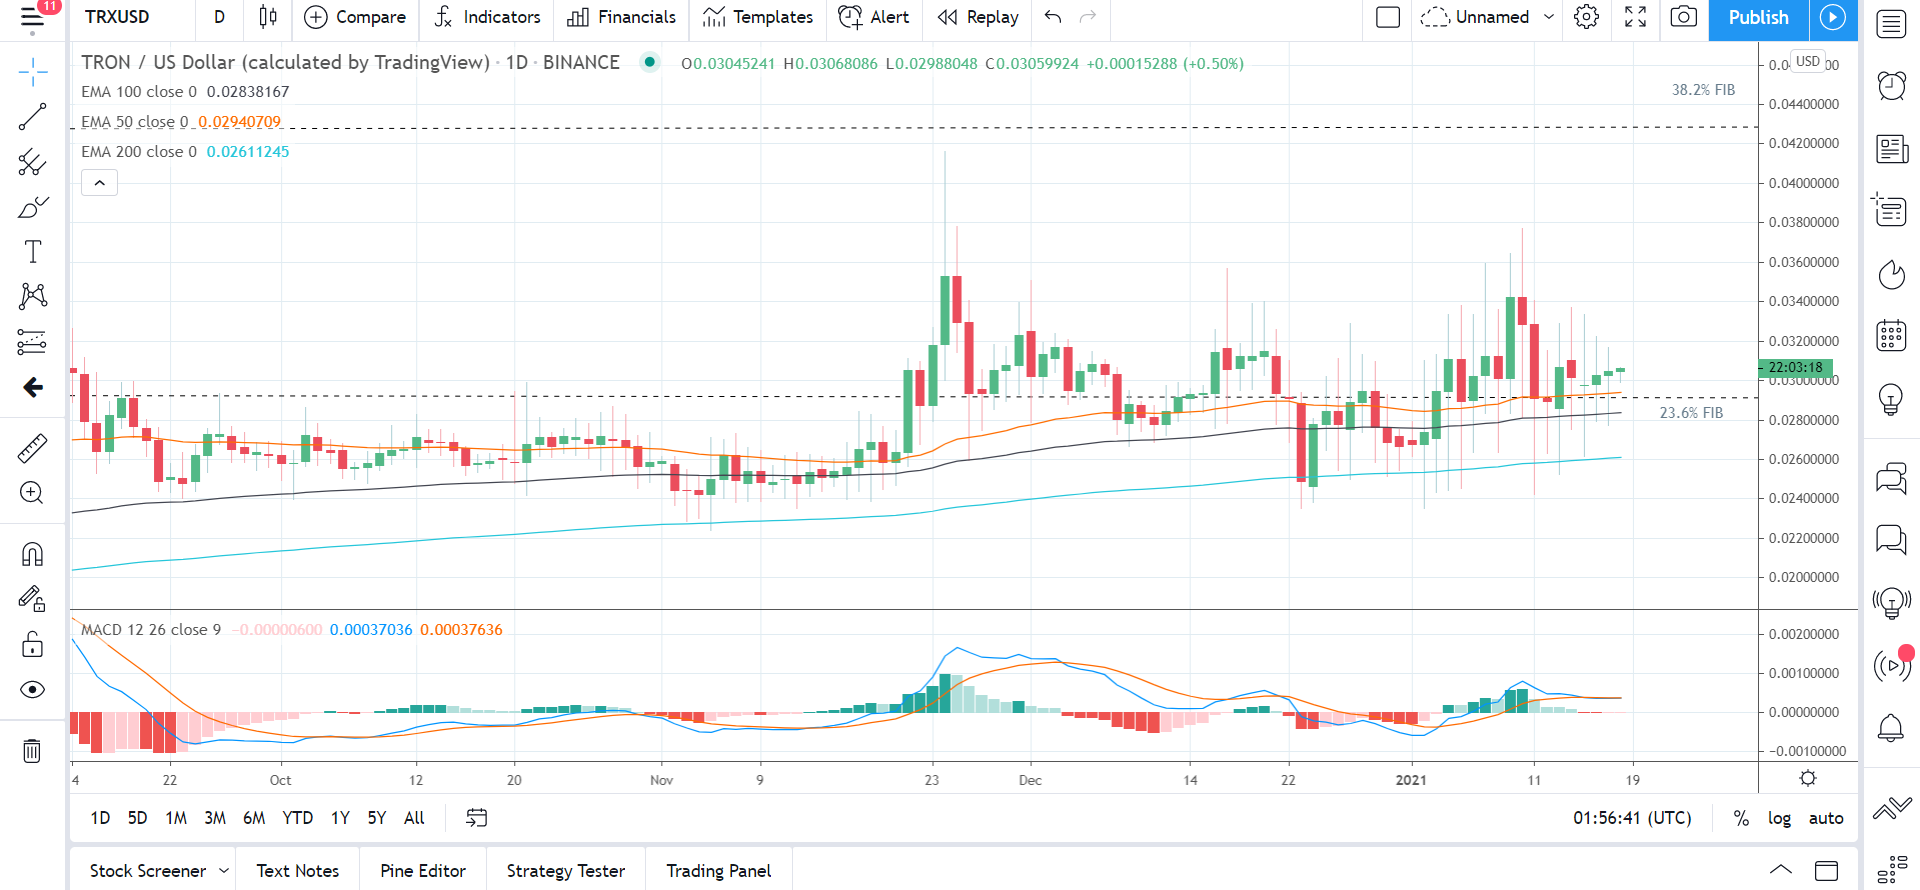
Tron’s TRX rose by 0.66% on Sunday. Following on from a 1.51% gain on Saturday, Tron’s TRX ended the week down by 7.23% to $0.03045.
A mixed start to the day saw Tron’s TRX rise to an early morning intraday high $0.03120 before hitting reverse.
Falling short of the first major resistance level at $0.3163, Tron’s TRX slid to a late morning intraday low $0.02876.
The reversal saw Tron’s TRX fall through the 23.6% FIB of $0.0291 and the first major support level at $0.02892.
Finding support through the afternoon, Tron’s TRX revisited $0.03090 levels before easing back.
At the time of writing, Tron’s TRX was up by 0.50% to $0.03060. A mixed start to the day saw Tron’s TRX fall to an early morning low $0.02988 before rising to a high $0.03068.
Tron’s TRX left the major support and resistance levels untested early on.
For the Day Ahead
Tron’s TRX would need to avoid a fall back through the $0.03014 pivot to bring the first major resistance level at $0.03151 back into play.
Support from the broader market would be needed, however, for Tron’s TRX to break back through to $0.031 levels.
Barring an extended crypto rally, the first major resistance level and Sunday’s high $0.03120 would likely cap any upside.
In the event of an extended rally Tron’s TRX could resistance at $0.33 before any pullback. The second major resistance level sits at $0.03258.
Failure to avoid a fall back through the $0.02964 pivot would bring the 23.6% FIB of $0.0291 and the first major support level at $0.02907 into play.
Barring another extended sell-off on the day, Tron’s TRX should steer clear of sub-$0.028 levels. The second major support level at sits at $0.02770.
Looking at the Technical Indicators
First Major Support Level: $0.02907
First Major Resistance Level: $0.03151
23.6% FIB Retracement Level: $0.03211
38.2% FIB Retracement Level: $0.0428
62% FIB Retracement Level: $0.0648
Please let us know what you think in the comments below
Thanks, Bob
About the Author
Bob Masonauthor
With over 20 years of experience in the finance industry, Bob has been managing regional teams across Europe and Asia and focusing on analytics across both corporate and financial institutions. Currently he is covering developments relating to the financial markets, including currencies, commodities, alternative asset classes, and global equities.
Did you find this article useful?
Latest news and analysis


Advertisement