
Advertisement
Advertisement
USD/JPY Forex Technical Analysis – Retracement Zone at 104.135 – 104.499 Capping Gains
By:
The low volume and the U.S. bank holiday could hold prices in a range with support at 103.496 and resistance at 104.135.

In this article:
The Dollar/Yen is inching lower early Monday on below average volume. The trade is light because of a U.S. bank holiday. The Forex pair could remain in a tight range all session with U.S. Treasury markets closed. The recent recovery in the Dollar/Yen has been fueled by a surge in Treasury yields.
At 03:58 GMT, the USD/JPY is trading 103.754, down 0.118 or -0.11%.
After surging to its highest level since December 10 last week, the USD/JPY has moved sideways to lower as Treasury yields fell from their highest level since March 2020. Risk sentiment and Treasury yields are expected to continue to exert the most influence on the Forex pair over the short-run. Investors particularly interested in the interest rate differential between U.S. Government bonds and Japanese Government bonds.
Daily Swing Chart Technical Analysis
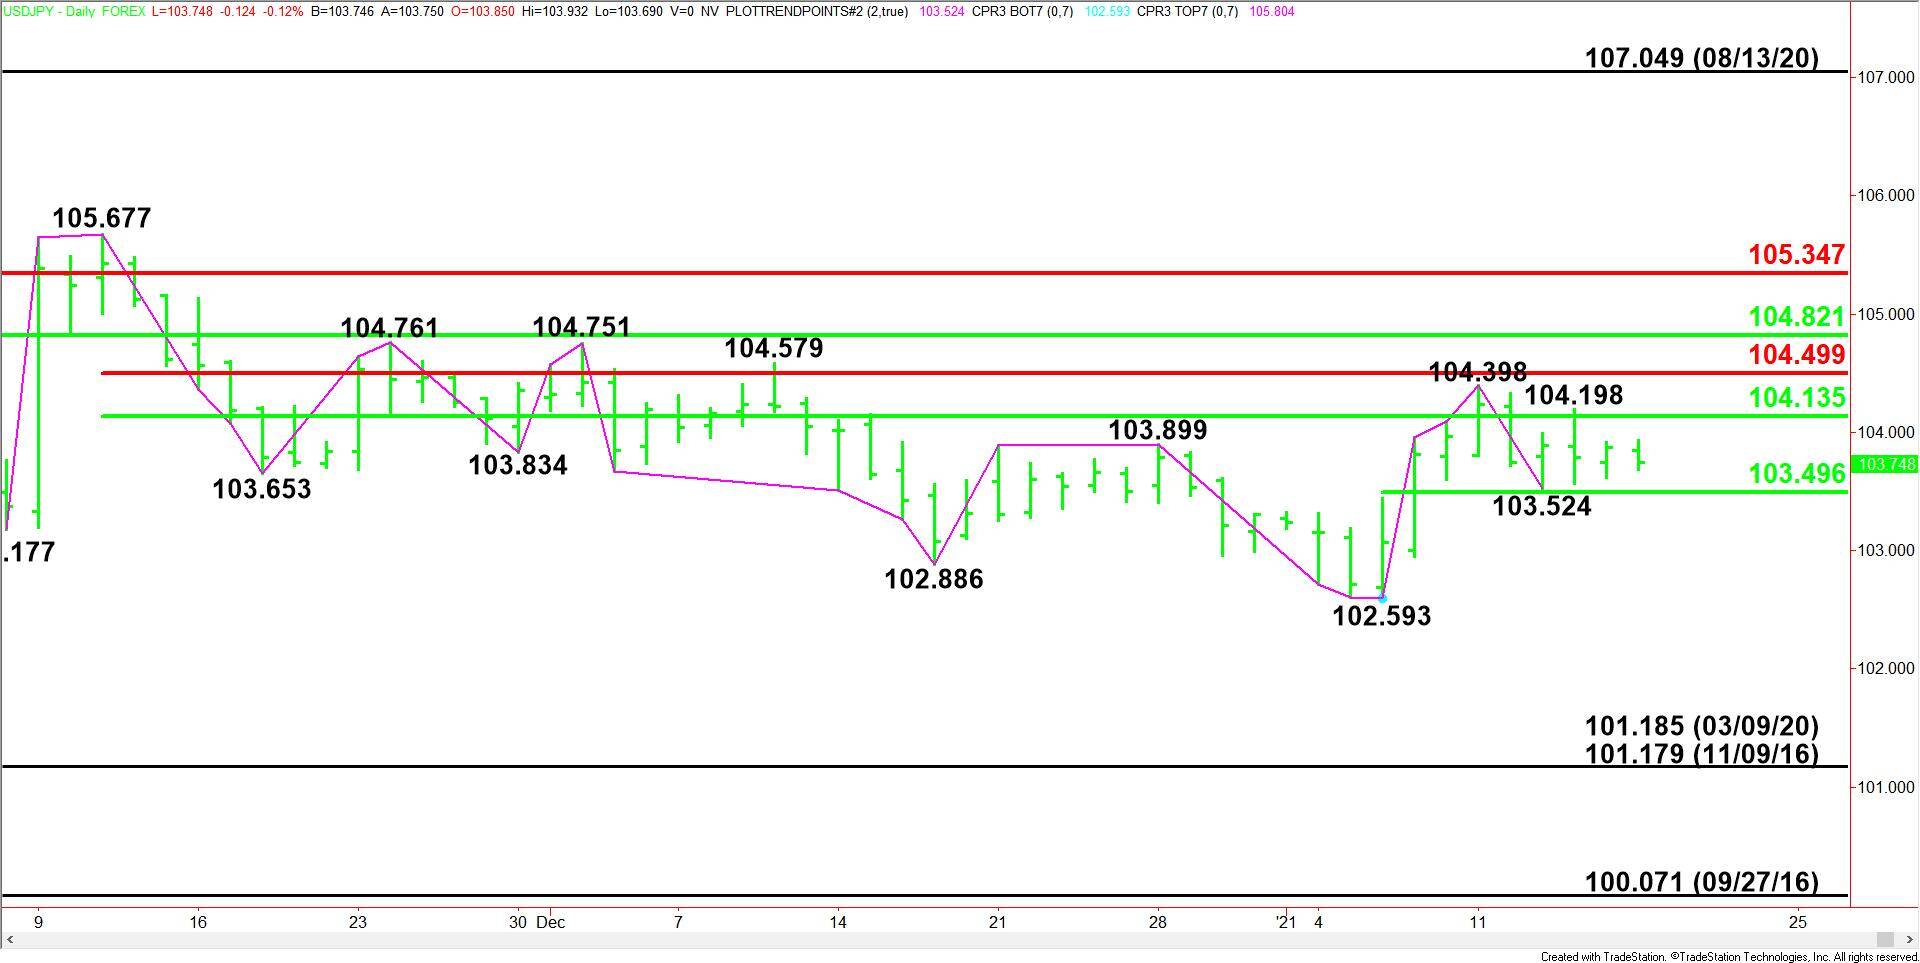
The main trend is up according to the daily swing chart. A trade through 104.398 will signal a resumption of the uptrend after five sessions of sideways price action. The main trend changes to down on a move through 102.593.
The minor trend is also up. A trade though 103.524 will change the minor trend to down. This will also shift momentum to the downside.
The minor range is 102.593 to 104.938. Its 50% level at 103.496 is potential support.
The short-term range is 105.677 to 102.593. Its retracement zone at 104.135 to 104.499 is resistance. This zone stopped the rally at 104.398 on January 11.
The main range is 107.049 to 102.593. Its retracement zone at 104.821 to 105.347 is controlling the near-term direction of the USD/JPY.
Daily Swing Chart Technical Forecast
The low volume and the U.S. bank holiday could hold prices in a range on Monday with a pair of 50% levels at 103.496 and 104.135 providing support and resistance respectively. The range could also extend to the minor bottom at 103.524 and the minor top at 104.198.
Bullish Scenario
Taking out 104.135 will indicate the presence of buyers, but the rally is likely to be labored because of a series of potential resistance levels at 104.398, 104.499, 104.751, 104.761 and 104.821. The buying is likely to expand on a move over 104.821.
Bearish Scenario
Taking out 103.496 will signal the presence of sellers. This could trigger an acceleration to the downside since the nearest support is 102.593.
For a look at all of today’s economic events, check out our economic calendar.
About the Author
James Hyerczykauthor
James is a Florida-based technical analyst, market researcher, educator and trader with 35+ years of experience. He is an expert in the area of patterns, price and time analysis as it applies to futures, Forex, and stocks.
Did you find this article useful?
Latest news and analysis


Advertisement