Join Our Telegram channel to stay up to date on breaking news coverage
Litecoin (LTC) Price Prediction – January 18
There is a significant drop in the valuation of LTC as traded against the US Dollar’s value on January 11 trading sessions.
LT/USD Market
Key Levels:
Resistance Levels: $180, $200, $220
Support Levels: $100, $80, $60
LTC/USD – Daily Chart
A long bearish candlestick emerged on January 11, leading to now seeing the 14-day SMA trend-line getting curved a bit above the present price trading region around the $140 mark. The 50-day SMA trend-line is underneath the smaller SMA indicator with a notable space between them. The Stochastic Oscillators are now seen seemingly attempting to begin a consolidation moving mode near range 40. That said, it shows that the crypto-trade may soon start to witness a line of sideway-price moves around the $140 value in near sessions.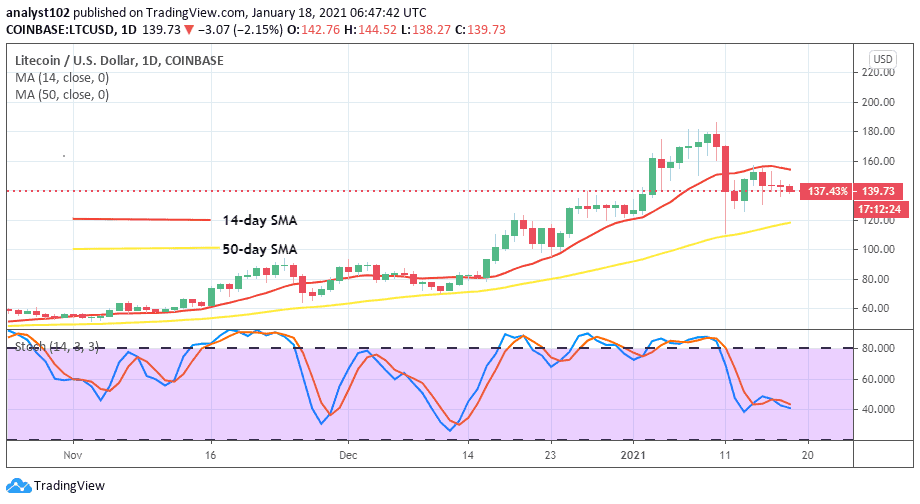
Where is LTC Price Going Next?
As the $140 price line, tends to possibly soon witnessing differential shorter-low and shorter-highs around it. It would be technically ideal for traders to be on the lookout for a decent price formation pattern before considering joining the market again. However, the LTC/USD market may be building-up from a support at $120 line. A violent downward-break could see the market recording other low value between $100 and $80 points.
A resistance price mark at $180 has set up a barrier in the furtherance of any future bullish attempting moves that the crypto-market may witness in no time as of now. In other words, selling entries may potentially come to play while bulls’ driving-forces possess weak momentum. In the meantime, a southward breach of the 50-day SMA trading indicator at $140 will suggest a decent sell-confirmation signal.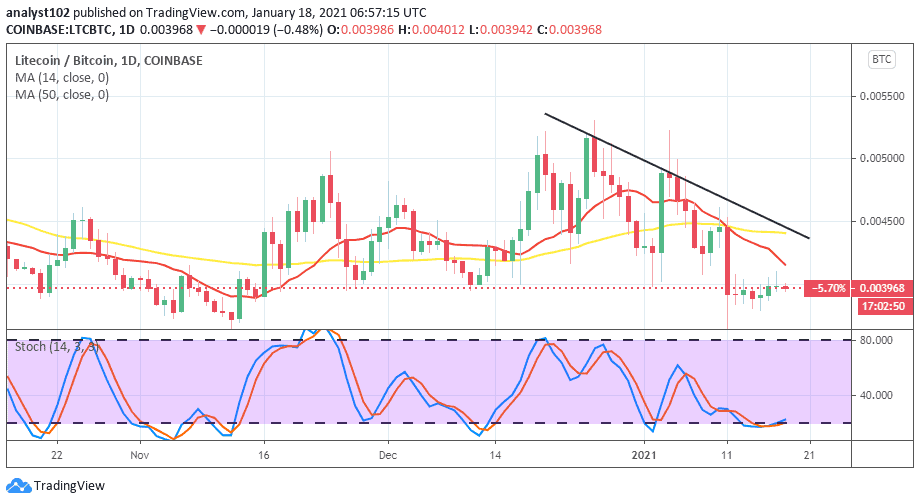
LTCBTC Price Analysis
Comparing the trade-worth between LTC and BTC, on January 11, the 50-day SMA trend-line was intercepted from the top by the 14-day SMA to showcase that the base crypto’s value is to some extent under a selling force. As the interception has just come afresh, a rebound rarely looks possible for the base-instrument to stage a come-back in the near time. The Stochastic Oscillators appear to commence a consolidation move around range 20. That suggests that the counter crypto is tightly holding weights in the trading operations.
Join Our Telegram channel to stay up to date on breaking news coverage