Join Our Telegram channel to stay up to date on breaking news coverage
LTC Price Prediction – January 19
After few days of the bullish movement, LTC/USD is seen recovering above the 21-day moving average.
LTC/USD Market
Key Levels:
Resistance levels: $185, $195, $205
Support levels: $130, $120, $110
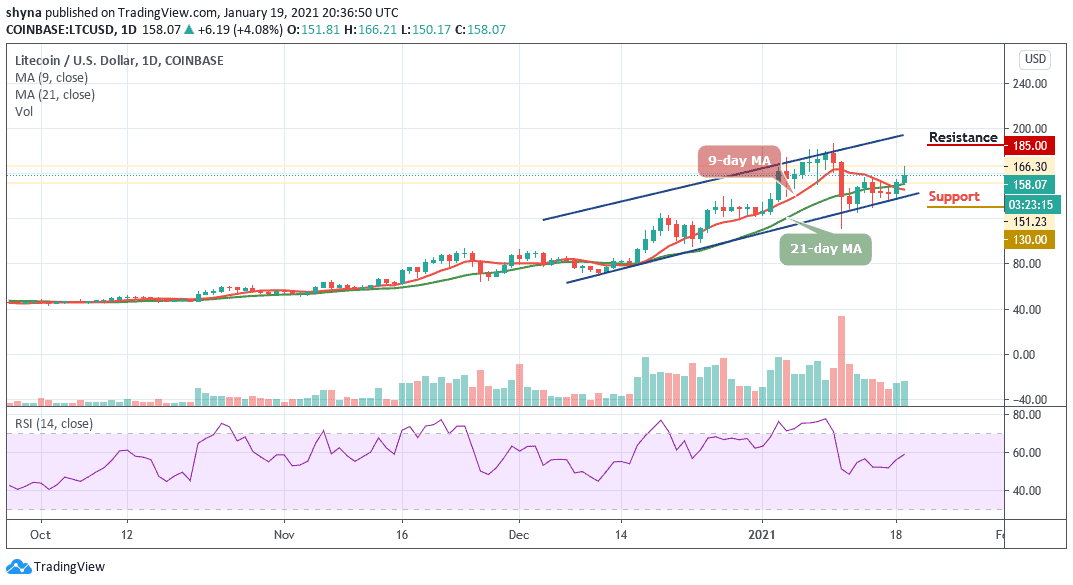
LTC/USD is currently trading at the support provided by a rising trend line. However, a break above the moving averages could suggest that the market is headed higher. Still, Litecoin has seen a slight increase of 4.08% in the past 24 hours, putting the coin’s market cap to $10.5 billion and in seventh place amongst the top cryptocurrencies.
Where is LTC Price Going Next?
As the market opens today, Litecoin price begins trading at $151.81 and it’s recovering towards $160 as of now. A bullish regroup may bring a decisive move with a potential break above the upper boundary of the channel. If such a scenario occurs, the price is likely to go as high as $185, $195, and $205. On the long-term outlook, LTC/USD remains indecisive as more rebounds are possible if the $158 can act strong.
While price remains above the moving averages, the LTC price is likely to go down to the $130, $120, and $110 supports if the bears turn up. To follow the RSI (14) indicator which is now reflected in the positive zone following the recent substantial rise in the market and leading to a price bounce on the daily chart, a possible upsurge is likely to push the market to the north.
When compares with Bitcoin, Litecoin price is moving slowly above the 9-day and 21-day moving averages. However, the cryptocurrency is yet to define an actual direction as price actions remained subdued with choppy price actions since the daily opening.
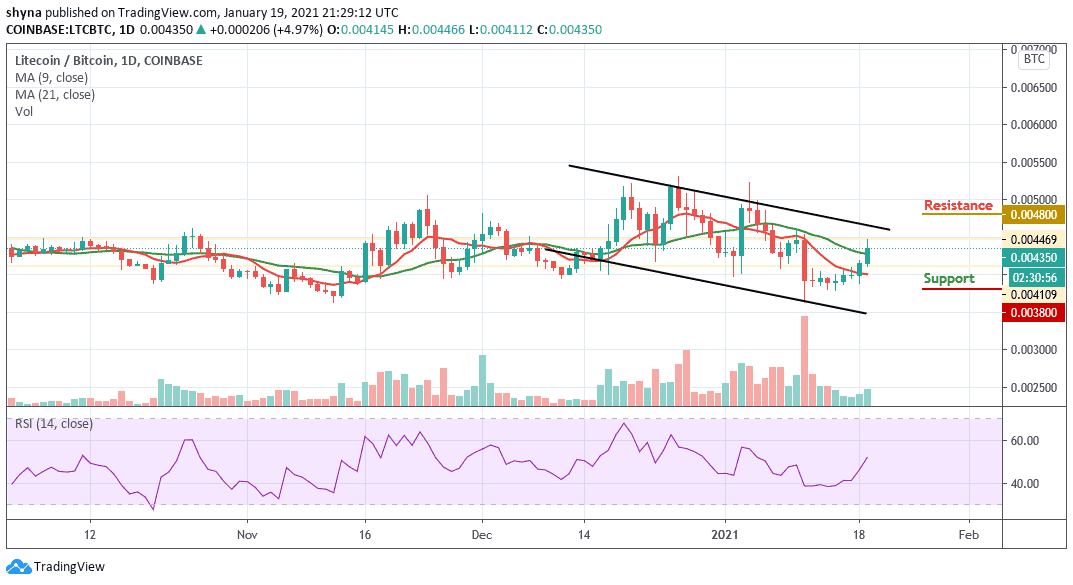
However, the nearest key supports lie at 0.0038 BTC and below in a subsequent move. Similarly, an upward movement across the upper boundary of the channel is likely to find immediate resistance at 0.0048 BTC and above. Meanwhile, the RSI (14) is convincingly moving above 50-level and as it stands now, the bulls are likely to gain control of the market.
Join Our Telegram channel to stay up to date on breaking news coverage