Gold (XAU/USD) fell 1% on Friday as risk-off mood and stellar US Markit Manufacturing PMI boosted the US dollar. Despite the decline, the yellow metal managed to close the week above the $1850 level, booking the first weekly gain in three weeks.
Expectations of a massive US fiscal stimulus under the Biden administration kept the sentiment underpinned around the inflation-hedge gold. The passage of the former Fed Chair Janet Yellen’s confirmation as the Treasury Secretary also offered some support to the metal. Yellen had called on the government to ‘act big’ in order to fight the pandemic-recession in her testimony last week.
Attention now turns towards next week’s FOMC decision and the first-tier US economic data fresh trading opportunity in gold. How is gold positioned technically heading into the Fed week?
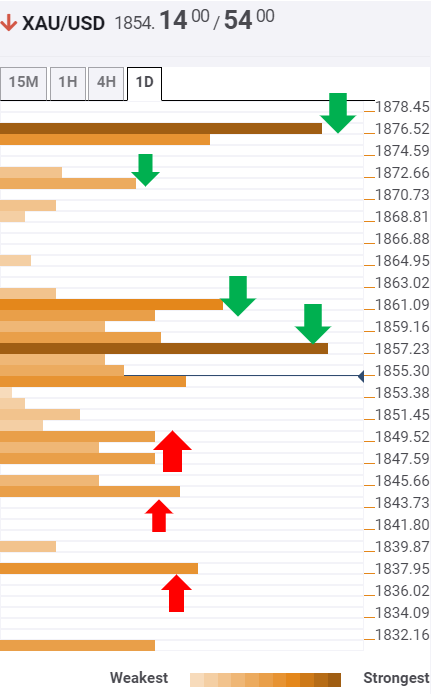
Gold Price Chart: Key resistances and supports
The Technical Confluences Indicator shows that gold could face an initial strong hurdle at $1857 when it opens a new week on Monday. That level is the confluence of the previous high on four-hour and Fibonacci 38.2% one-month.
A cluster of dense upside barrier is located around $1860-$1862, where the SMA50 one-day, Fibonacci 61.8% one-day and SMA10 four-hour converge.
A fresh rally towards the next upside target of $1872 (pivot point one-day R1) could be triggered on an acceptance above the $1860-$1862 range.
Further north, the bulls could then challenge $1875/76 levels, which is the intersection of the Fibonacci 23.6% one-month, the previous week high and SMA100 four-hour.
Alternatively, the confluence of the SMA200 one-hour, SMA50 four-hour and SMA10 one-day around $1849 will likely guard the downside.
A break below the latter could call for a test of a minor $1845 cap, Bollinger Band one-hour Lower.
The next relevant cushion is seen at $1838, where the previous low one-day coincides with the pivot point one-day S1.
Here is how it looks on the tool
About Confluence Detector
The TCI (Technical Confluences Indicator) is a tool to locate and point out those price levels where there is a congestion of indicators, moving averages, Fibonacci levels, Pivot Points, etc. Knowing where these congestion points are located is very useful for the trader, and can be used as a basis for different strategies.
Learn more about Technical Confluence
Information on these pages contains forward-looking statements that involve risks and uncertainties. Markets and instruments profiled on this page are for informational purposes only and should not in any way come across as a recommendation to buy or sell in these assets. You should do your own thorough research before making any investment decisions. FXStreet does not in any way guarantee that this information is free from mistakes, errors, or material misstatements. It also does not guarantee that this information is of a timely nature. Investing in Open Markets involves a great deal of risk, including the loss of all or a portion of your investment, as well as emotional distress. All risks, losses and costs associated with investing, including total loss of principal, are your responsibility. The views and opinions expressed in this article are those of the authors and do not necessarily reflect the official policy or position of FXStreet nor its advertisers. The author will not be held responsible for information that is found at the end of links posted on this page.
If not otherwise explicitly mentioned in the body of the article, at the time of writing, the author has no position in any stock mentioned in this article and no business relationship with any company mentioned. The author has not received compensation for writing this article, other than from FXStreet.
FXStreet and the author do not provide personalized recommendations. The author makes no representations as to the accuracy, completeness, or suitability of this information. FXStreet and the author will not be liable for any errors, omissions or any losses, injuries or damages arising from this information and its display or use. Errors and omissions excepted.
The author and FXStreet are not registered investment advisors and nothing in this article is intended to be investment advice.
Recommended content
Editors’ Picks
AUD/USD failed just ahead of the 200-day SMA

Finally, AUD/USD managed to break above the 0.6500 barrier on Wednesday, extending the weekly recovery, although its advance faltered just ahead of the 0.6530 region, where the key 200-day SMA sits.
EUR/USD met some decent resistance above 1.0700

EUR/USD remained unable to gather extra upside traction and surpass the 1.0700 hurdle in a convincing fashion on Wednesday, instead giving away part of the weekly gains against the backdrop of a decent bounce in the Dollar.
Gold stays firm amid higher US yields as traders await US GDP data

Gold recovers from recent losses, buoyed by market interest despite a stronger US Dollar and higher US Treasury yields. De-escalation of Middle East tensions contributed to increased market stability, denting the appetite for Gold buying.
Ethereum suffers slight pullback, Hong Kong spot ETH ETFs to begin trading on April 30

Ethereum suffered a brief decline on Wednesday afternoon despite increased accumulation from whales. This follows Ethereum restaking protocol Renzo restaked ETH crashing from its 1:1 peg with ETH and increased activities surrounding spot Ethereum ETFs.
Dow Jones Industrial Average hesitates on Wednesday as markets wait for key US data

The DJIA stumbled on Wednesday, falling from recent highs near 38,550.00 as investors ease off of Tuesday’s risk appetite. The index recovered as US data continues to vex financial markets that remain overwhelmingly focused on rate cuts from the US Fed.