Join Our Telegram channel to stay up to date on breaking news coverage
LTC Price Prediction – January 23
The Litecoin price is currently changing hands at $138.96, trading under the moving averages.
LTC/USD Market
Key Levels:
Resistance levels: $165, $175, $185
Support levels: $110, $100, $90
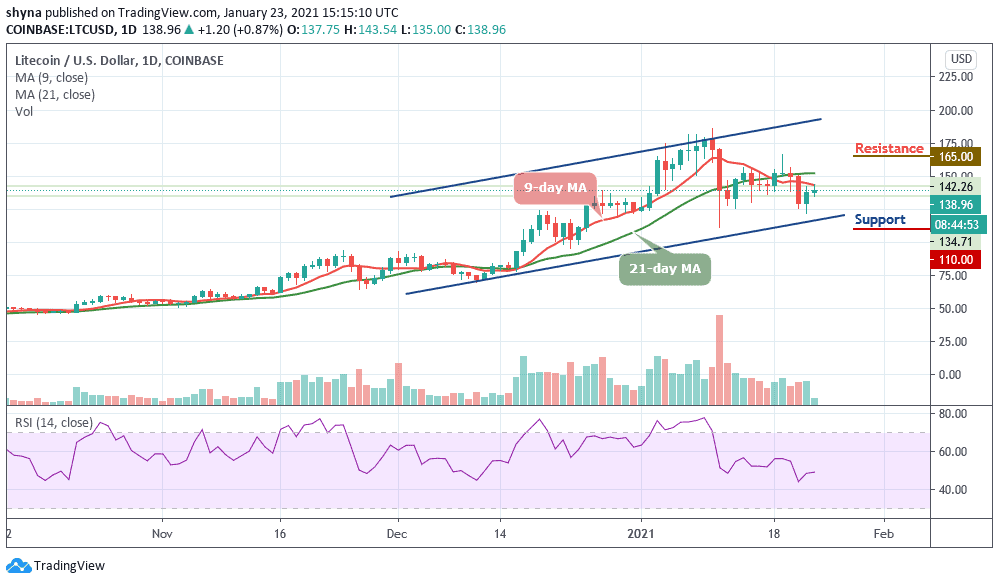
LTC/USD is currently trading at around $138.96 as it manages to surpass the opening price at $137.75. More so, the next target is at $143 where it touched a few hours ago. Meanwhile, a breach from the current market value may send the price straight above the 9-day and 21-day moving averages. Therefore, if this level fails to hold strong, the price could slip below the lower boundary of the channel at $115.
What to Expect from Litecoin (LTC)
Looking at the current market sentiment, bulls may likely come back into the market if they can put more effort and push the market above the 9-day and 21-day moving averages, then the market price may likely hit the resistance levels of $165, $175, and $185 respectively. Moreover, any bullish movement above the key resistance levels may encourage further buying in the market.
On the other hand, a break below the lower boundary of the channel may provoke an even deeper decline towards the $110, $100, and $90 support levels. Meanwhile, looking at the technical indicator RSI (14), Litecoin may exhibit the tendencies to follow the sideways movement as the coin moves in the same direction below the 50-level which may cause the market to remain indecisive.
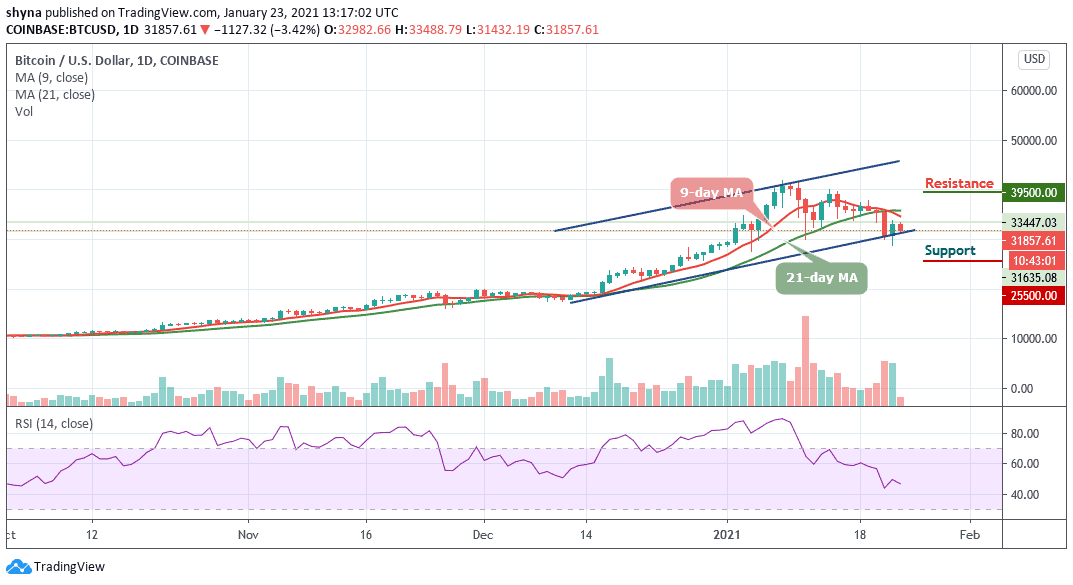
When compared to Bitcoin, the Litecoin price is making an attempt to cross and stay above the 9-day and 21-day moving averages, as the coin continues to explode higher. Meanwhile, little is what the bulls can do as the 9-day MA remains under the 21-day MA which may retain the coin within the negative side. The critical support level is located at 3800 SAT and below.
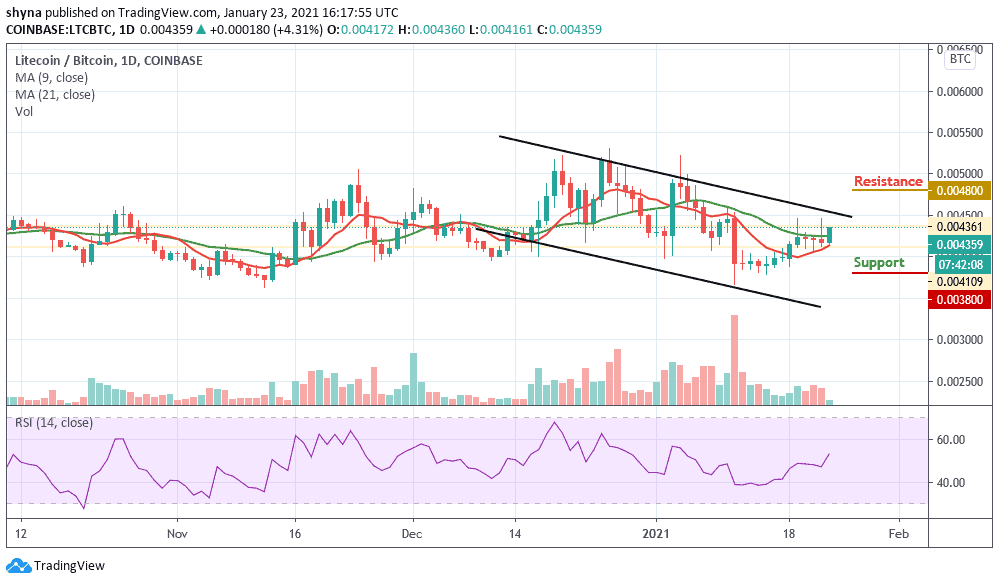
However, if the bulls can continue to power the market, the coin may likely cross above the upper boundary of the channel to reach the resistance level at 4800 SAT and above. Meanwhile, the price of Litecoin is currently following an upward movement as the RSI (14) moves above 50-level, suggesting more bullish signals.
Join Our Telegram channel to stay up to date on breaking news coverage