Join Our Telegram channel to stay up to date on breaking news coverage
LTC Price Prediction – January 24
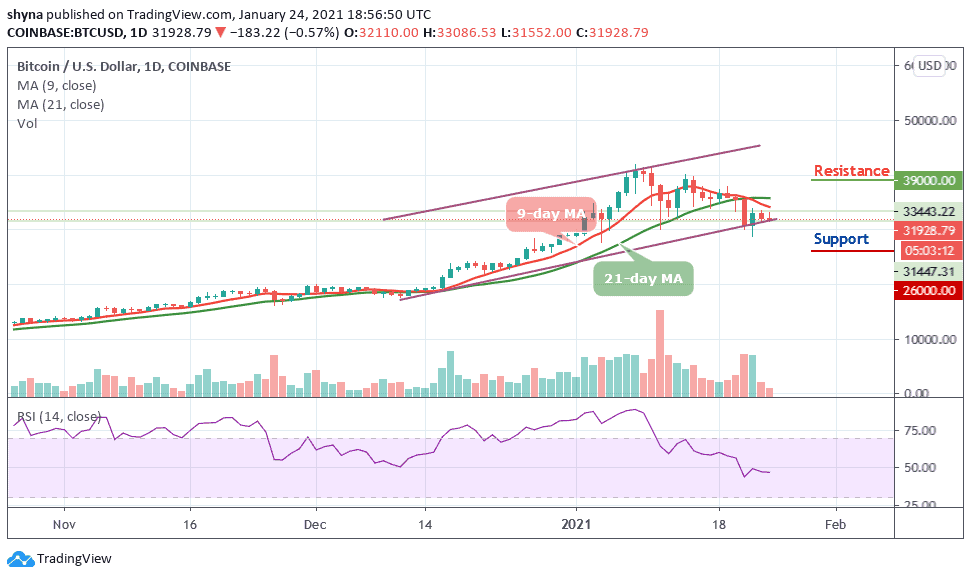
Since January 12, Litecoin has been trading marginally after its rejection from the $186 price level.
LTC/USD Market
Key Levels:
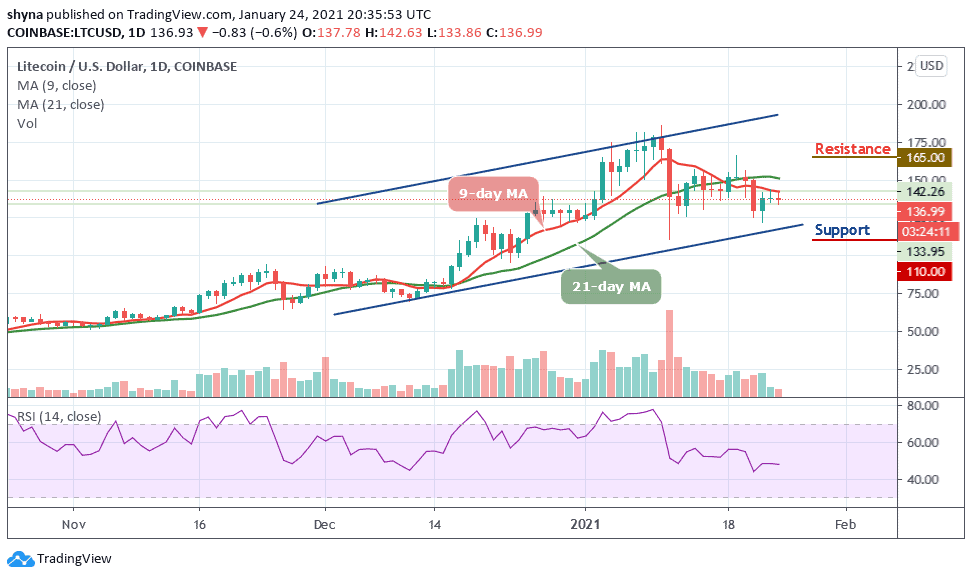
Resistance levels: $165, $175, $185
Support levels: $110, $100, $90
In the past few days, LTC/USD has continued to trade marginally below the 9-day and 21-day moving averages as there has been no significant price movement. The Litecoin (LTC) has been fluctuating between $125 and $140. Meanwhile, according to the technical indicator RSI (14), Litecoin is trading below the 50-level which indicates that the coin is moving sideways at the moment.
What to Expect from Litecoin (LTC)
The Litecoin price is trading below the moving averages after touching the daily high at $142 in the early hours of today. However, the price may retest or break below the $130 support. Meanwhile, if the recent market movement convincingly breaks above the moving averages and the bullish momentum is sustained, the crypto is expected to reach the resistance levels of $165, $175, and $185 respectively.
Nevertheless, the daily chart shows that the Litecoin price has been moving sideways since a few days ago as its price could approach the $130 support level if it breaks below the current value at $136.99, the next supports could be located at $110, $100, and $90. On the other hand, the technical indicator RSI (14) is indecisive as the signal line moves in the same direction.
Against Bitcoin, the Litecoin price is trading above the 9-day and 21-day moving averages, as the coin moves toward the north. However, the market may keep and maintain the upward movement if the 9-day MA can successfully cross above the 21-day MA. Therefore, trading above the upper boundary of the channel can lead to potential resistance at 4800 SAT and above.
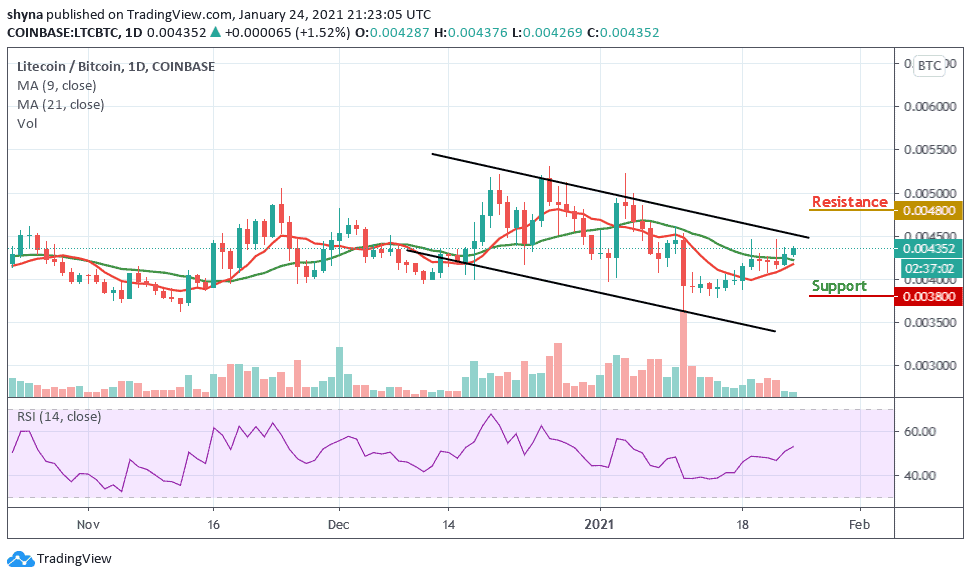
Moreover, if the bears drag the market price below the moving averages, the coin may likely the support level at 3800 SAT and below. Inversely, the Litecoin price is currently following an upward movement as the RSI (14) moves above 50-level, giving additional bullish signals.
Join Our Telegram channel to stay up to date on breaking news coverage