- The US dollar weakness fails to lift gold.
- An impending death cross may mark a major bottom.
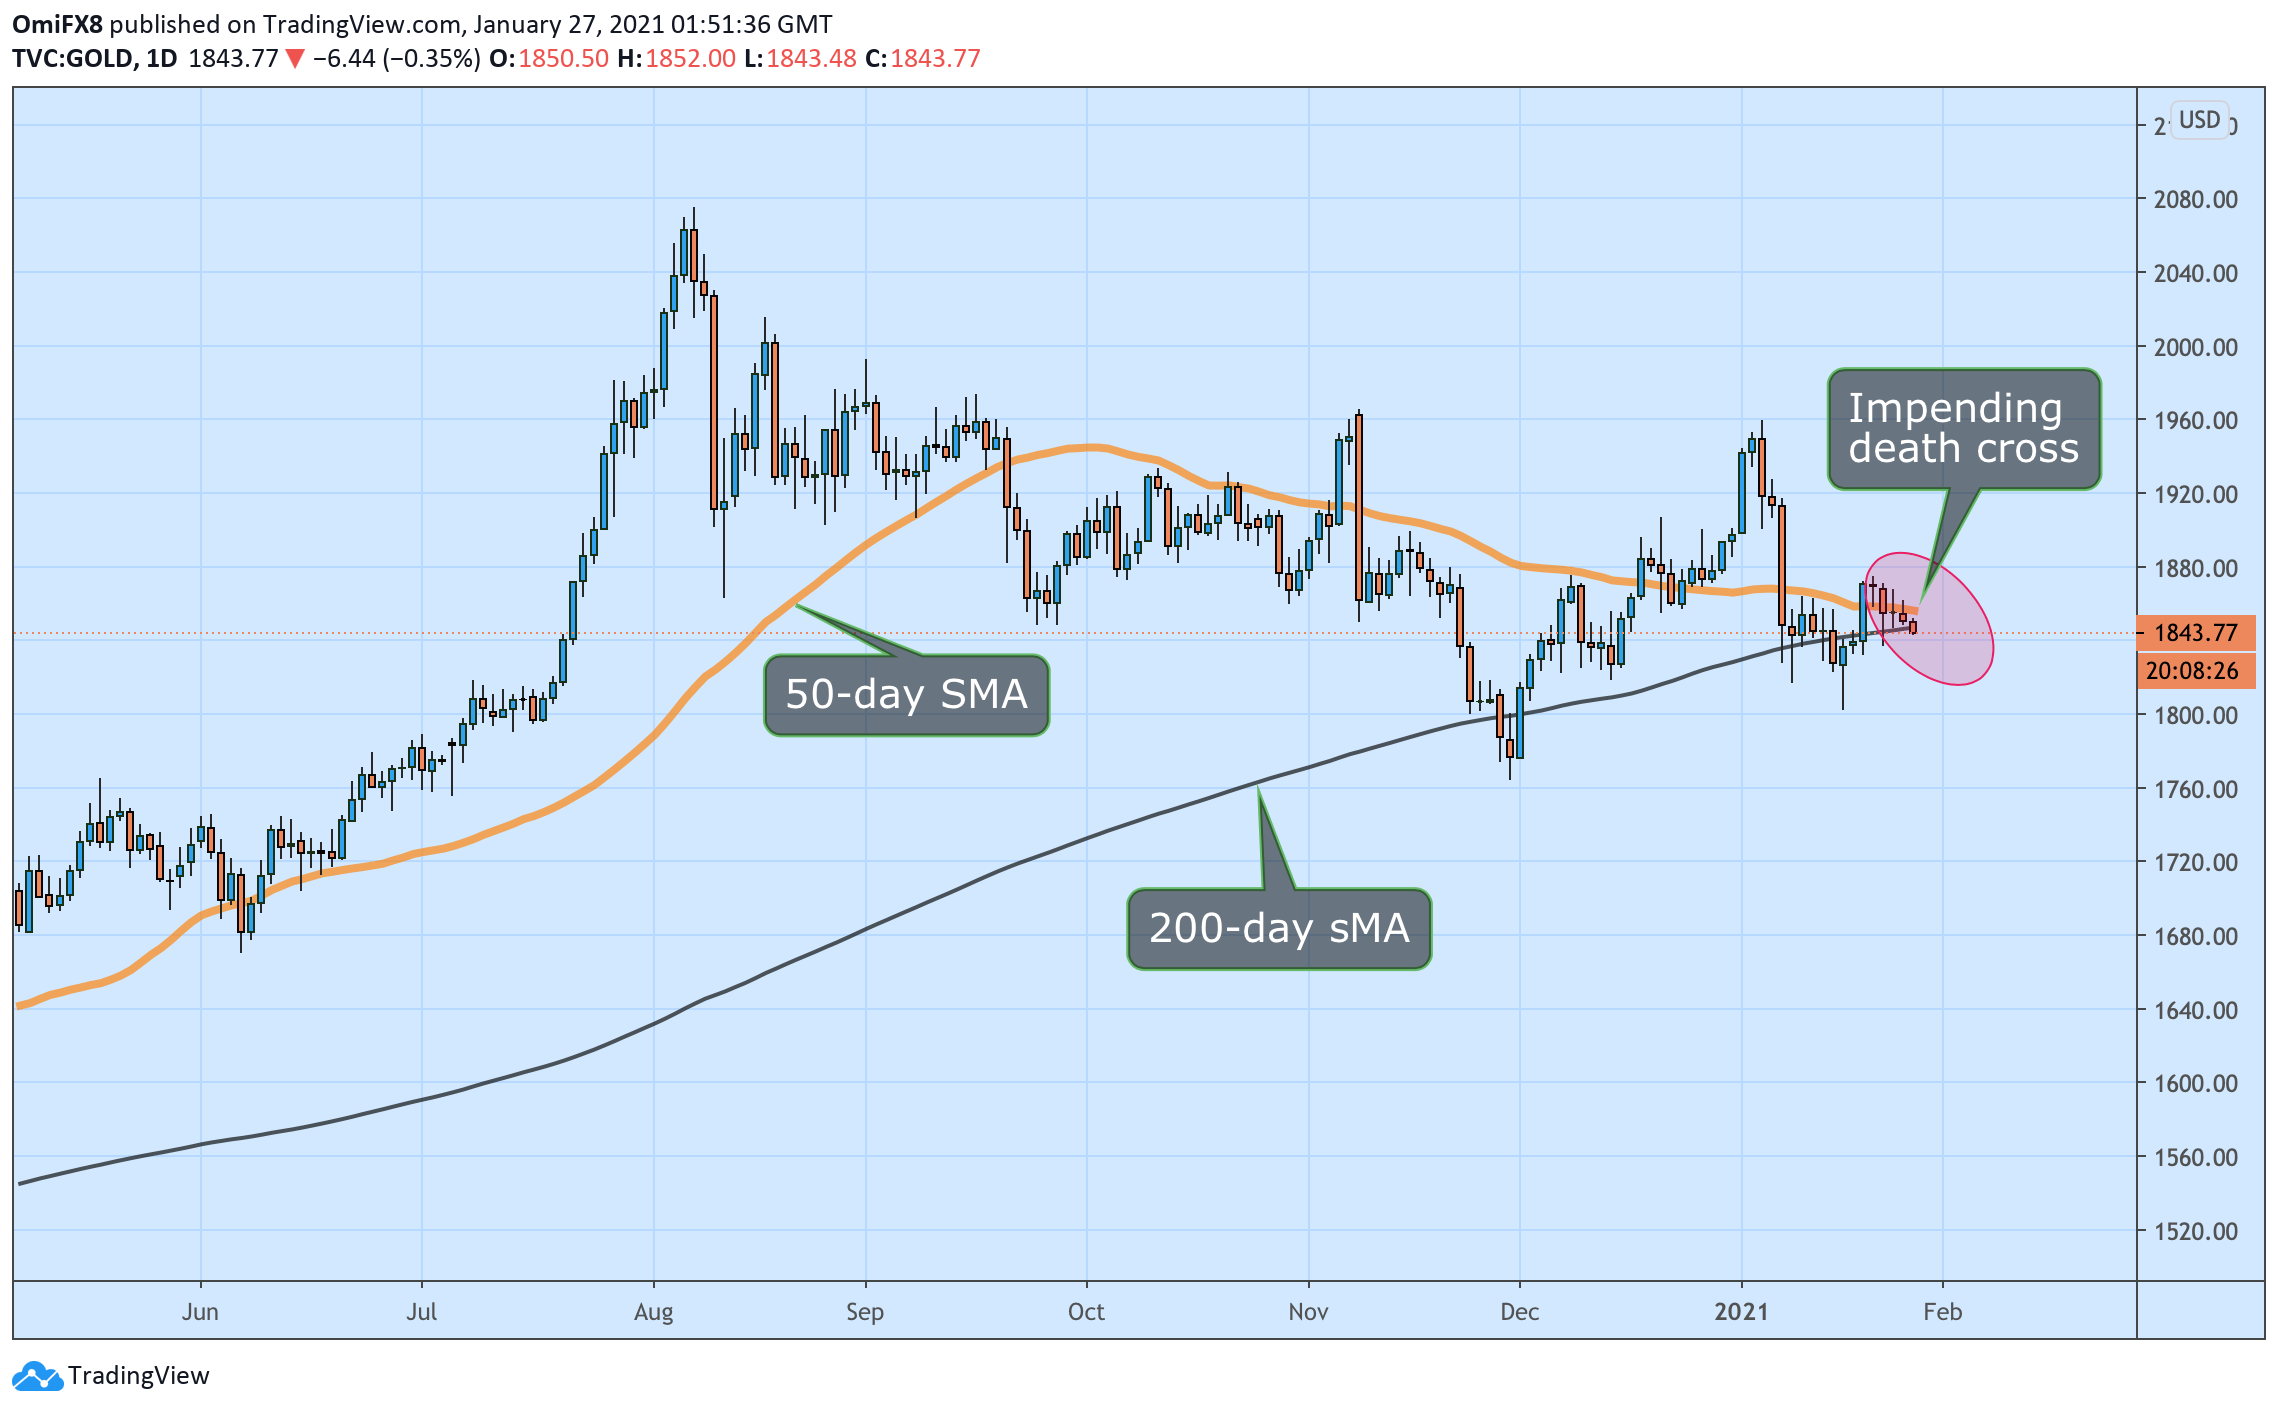
Gold lacks clear directional bias despite an improved risk appetite and weakness in the US dollar. The yellow metal's daily chart shows key averages are set to chart a bearish crossover.
At press time, gold is trading near $1,845 per ounce, having dropped by 0.24% on Monday.
The US President Joe Biden announced on Tuesday that his administration is boosting weekly vaccine supply, weakening the selling pressure in stocks, and pushing the anti-risk dollar lower. Additional bearish pressure likely emerged from the International Monetary Fund's upward revision of the 2021 global growth forecasts.
The dollar index, which tracks the greenback's value against majors, fell 0.27% to 90.27 on Tuesday and is trading flat near that level at press time. So far, however, the dollar weakness has failed to propel gold higher.
The bulls need quick progress, as the 50-day Simple Moving Average (SMA) is on track to cross below the 200-day SMA in the next couple of days. That would confirm a death cross, a long-term bearish indicator.
However, crossovers are lagging indicators, as SMAs are based on historical data and often mark major bottoms/tops. The metal's downtrend from the record high of $2,075 reached in August may bottom out with the impending death cross.
A move above the lower high of $1,875 created on Jan. 21 is needed to confirm a short-term bullish reversal. Meanwhle, the Jan. 18 low of $1,802 is the level to beat for the sellers.
Daily chart
Trend: Neutral-to-bullish
Technical levels
Information on these pages contains forward-looking statements that involve risks and uncertainties. Markets and instruments profiled on this page are for informational purposes only and should not in any way come across as a recommendation to buy or sell in these assets. You should do your own thorough research before making any investment decisions. FXStreet does not in any way guarantee that this information is free from mistakes, errors, or material misstatements. It also does not guarantee that this information is of a timely nature. Investing in Open Markets involves a great deal of risk, including the loss of all or a portion of your investment, as well as emotional distress. All risks, losses and costs associated with investing, including total loss of principal, are your responsibility. The views and opinions expressed in this article are those of the authors and do not necessarily reflect the official policy or position of FXStreet nor its advertisers. The author will not be held responsible for information that is found at the end of links posted on this page.
If not otherwise explicitly mentioned in the body of the article, at the time of writing, the author has no position in any stock mentioned in this article and no business relationship with any company mentioned. The author has not received compensation for writing this article, other than from FXStreet.
FXStreet and the author do not provide personalized recommendations. The author makes no representations as to the accuracy, completeness, or suitability of this information. FXStreet and the author will not be liable for any errors, omissions or any losses, injuries or damages arising from this information and its display or use. Errors and omissions excepted.
The author and FXStreet are not registered investment advisors and nothing in this article is intended to be investment advice.
Recommended content
Editors’ Picks
US economy grows at an annual rate of 1.6% in Q1 – LIVE

The US' real GDP expanded at an annual rate of 1.6% in the first quarter, the US Bureau of Economic Analysis' first estimate showed on Thursday. This reading came in worse than the market expectation for a growth of 2.5%.
EUR/USD retreats to 1.0700 after US GDP data

EUR/USD came under modest bearish pressure and retreated to the 1.0700 area. Although the US data showed that the economy grew at a softer pace than expected in Q1, strong inflation-related details provided a boost to the USD.
GBP/USD declines below 1.2500 with first reaction to US data

GBP/USD declined below 1.2500 and erased a portion of its daily gains with the immediate reaction to the US GDP report. The US economy expanded at a softer pace than expected in Q1 but the price deflator jumped to 3.4% from 1.8%.
Gold falls below $2,330 as US yields push higher

Gold came under modest bearish pressure and declined below $2,330. The benchmark 10-year US Treasury bond yield is up more than 1% on the day after US GDP report, making it difficult for XAU/USD to extend its daily recovery.
XRP extends its decline, crypto experts comment on Ripple stablecoin and benefits for XRP Ledger

Ripple extends decline to $0.52 on Thursday, wipes out weekly gains. Crypto expert asks Ripple CTO how the stablecoin will benefit the XRP Ledger and native token XRP.