- Gold witnessed some follow-through selling for the second consecutive session.
- Break below a symmetrical triangle might have set the stage for further weakness.
- A sharp fall in the global equity markets could help limit losses ahead of the FOMC.
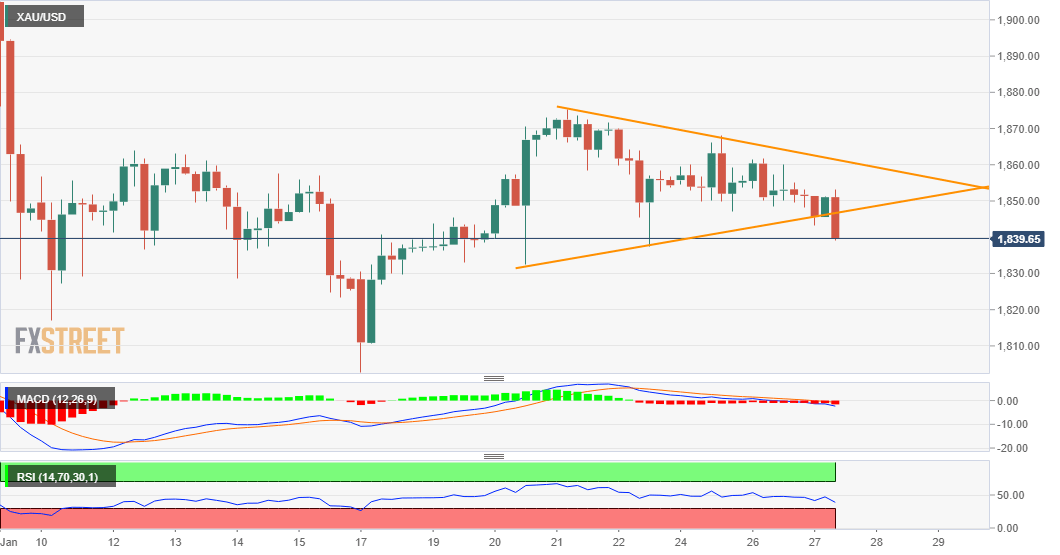
Gold remained depressed through the mid-European session and dropped to fresh weekly lows, around the $1842-41 region in the last hour. Bearish traders are now looking to drag the commodity further below a one-week-old ascending trend-line, which constituted the formation of a symmetrical triangle.
Given the recent sharp pullback from monthly tops, around the $1960 region touched on January 6, the triangle could be categorised as a bearish continuation pattern – pennant. This, in turn, favours bearish traders and supports prospects for the resumption of a one-month-old downward trajectory.
Meanwhile, technical indicators on hourly charts have been gaining negative traction and have just started drifting into the bearish territory on the daily chart. This further adds credence to the negative outlook and a possible slide back towards challenging the $1800 round-figure mark.
In the meantime, intermediate support levels are pegged near the $1835 region ahead of the $1827 level and $1820-18 area. A sharp pullback in the equity markets could extend some support to the safe-haven XAU/USD and help limit deeper losses as the focus remains on the FOMC monetary policy decision.
On the flip side, the $1851-52 horizontal zone now seems to act as immediate resistance. Any subsequent move beyond the mentioned hurdle might still be seen as a selling opportunity and runs the risk of fizzling out rather quickly near the triangle resistance, around the $1860-62 region.
XAU/USD 4-hourly chart
Technical levels to watch
Information on these pages contains forward-looking statements that involve risks and uncertainties. Markets and instruments profiled on this page are for informational purposes only and should not in any way come across as a recommendation to buy or sell in these assets. You should do your own thorough research before making any investment decisions. FXStreet does not in any way guarantee that this information is free from mistakes, errors, or material misstatements. It also does not guarantee that this information is of a timely nature. Investing in Open Markets involves a great deal of risk, including the loss of all or a portion of your investment, as well as emotional distress. All risks, losses and costs associated with investing, including total loss of principal, are your responsibility. The views and opinions expressed in this article are those of the authors and do not necessarily reflect the official policy or position of FXStreet nor its advertisers. The author will not be held responsible for information that is found at the end of links posted on this page.
If not otherwise explicitly mentioned in the body of the article, at the time of writing, the author has no position in any stock mentioned in this article and no business relationship with any company mentioned. The author has not received compensation for writing this article, other than from FXStreet.
FXStreet and the author do not provide personalized recommendations. The author makes no representations as to the accuracy, completeness, or suitability of this information. FXStreet and the author will not be liable for any errors, omissions or any losses, injuries or damages arising from this information and its display or use. Errors and omissions excepted.
The author and FXStreet are not registered investment advisors and nothing in this article is intended to be investment advice.
Recommended content
Editors’ Picks
EUR/USD regains traction, recovers above 1.0700

EUR/USD regained its traction and turned positive on the day above 1.0700 in the American session. The US Dollar struggles to preserve its strength after the data from the US showed that the economy grew at a softer pace than expected in Q1.
GBP/USD returns to 1.2500 area in volatile session

GBP/USD reversed its direction and recovered to 1.2500 after falling to the 1.2450 area earlier in the day. Although markets remain risk-averse, the US Dollar struggles to find demand following the disappointing GDP data.
Gold climbs above $2,340 following earlier drop

Gold fell below $2,320 in the early American session as US yields shot higher after the data showed a significant increase in the US GDP price deflator in Q1. With safe-haven flows dominating the markets, however, XAU/USD reversed its direction and rose above $2,340.
XRP extends its decline, crypto experts comment on Ripple stablecoin and benefits for XRP Ledger

Ripple extends decline to $0.52 on Thursday, wipes out weekly gains. Crypto expert asks Ripple CTO how the stablecoin will benefit the XRP Ledger and native token XRP.
After the US close, it’s the Tokyo CPI

After the US close, it’s the Tokyo CPI, a reliable indicator of the national number and then the BoJ policy announcement. Tokyo CPI ex food and energy in Japan was a rise to 2.90% in March from 2.50%.