
Advertisement
Advertisement
Gold Price Futures (GC) Technical Analysis – Weakens Under $1843.00, Strengthens Over $1849.70
By:
The early price action suggests the direction of the April Comex gold futures contract will be determined by trader reaction to $1843.00.

In this article:
Gold futures are edging lower on Wednesday amid a rebound in the U.S. Dollar against a basket of major currencies following a weaker trade the previous session. The choppy two-sided trade this week is being fueled by uncertainty ahead of the release of the U.S. Federal Reserve’s policy statement at 19:00 GMT and the start of negotiations between Democrats and Republicans over President Joe Biden’s coronavirus relief proposal.
At 12:47 GMT, April Comex gold is trading $1841.60, down $13.20 or -0.71%.
The Fed is expected to stand pat on policy when it announces its decision. Investors will be watching for Fed Chairman Jerome Powell’s tone for clues on the state of the economy.
Meanwhile, U.S. President Joe Biden’s $1.9 trillion stimulus plan has been met with objections from Republicans over the price tag.
Daily Swing Chart Technical Analysis
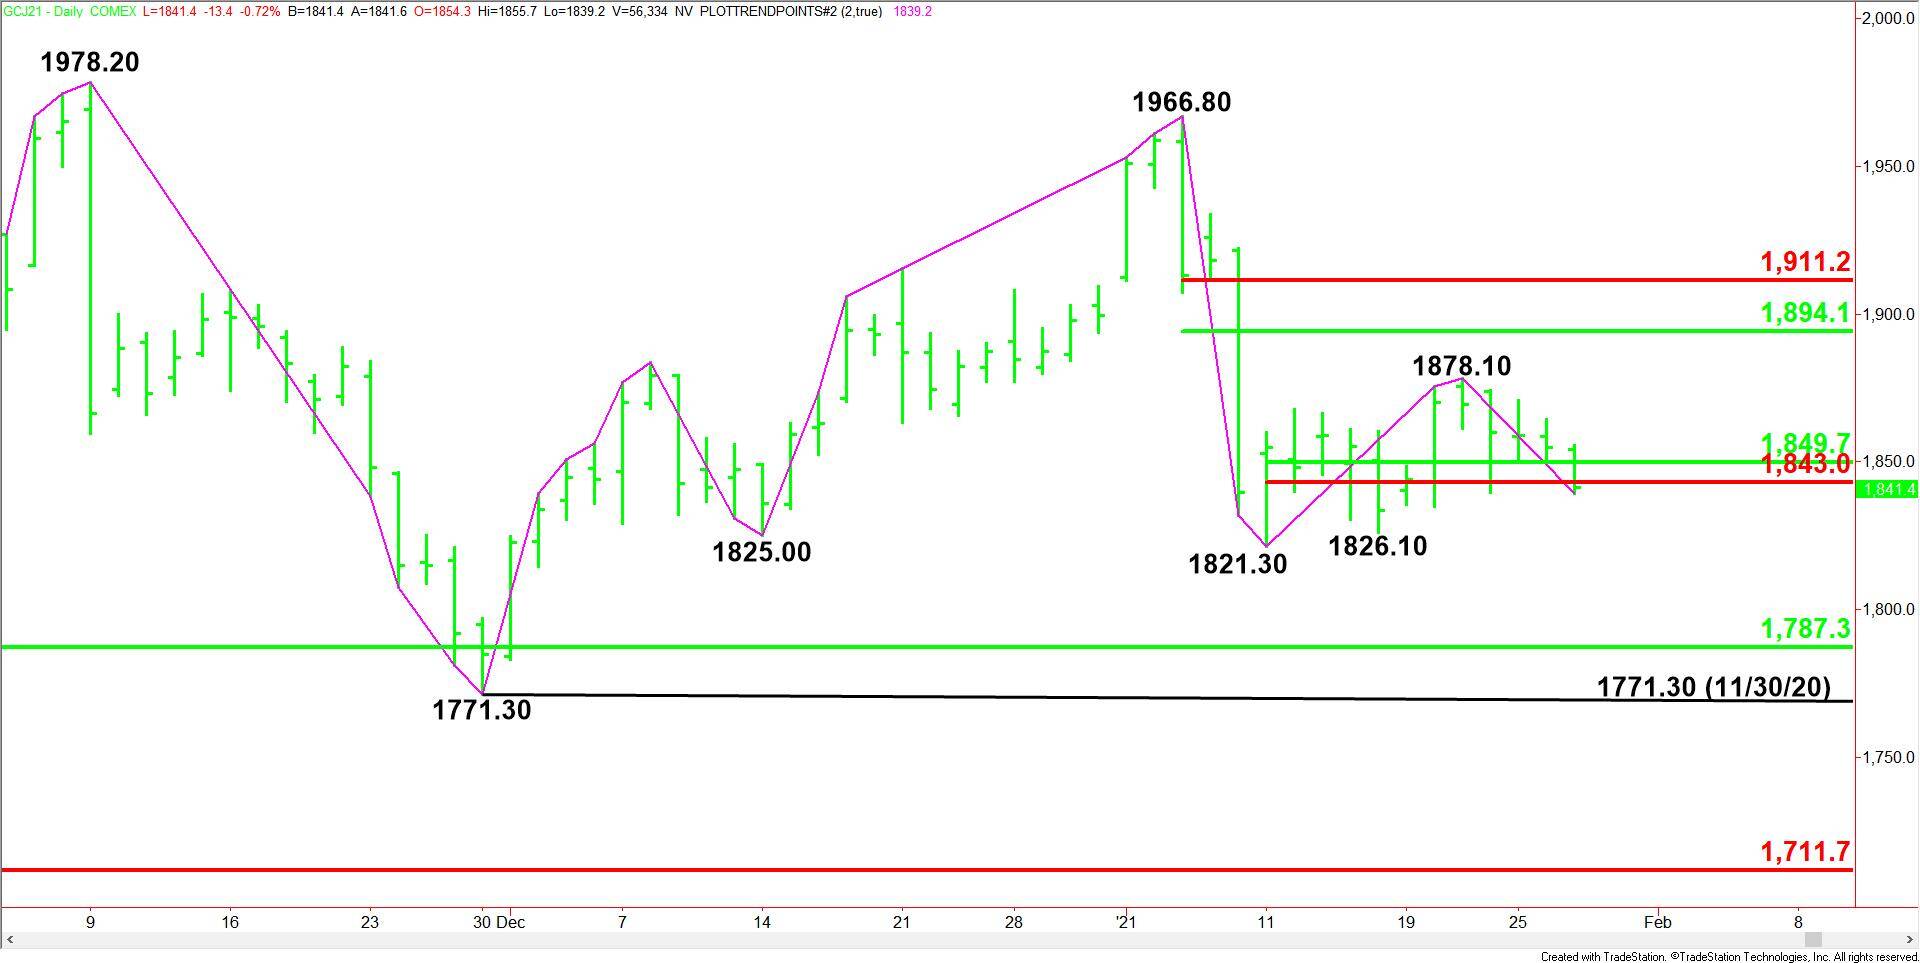
The main trend is down according to the daily swing chart. However, momentum is drifting higher. A trade through $1821.20 will reaffirm the downtrend. A move through $1966.80 will change the main trend to up.
A trade through $1839.70 will turn $1878.10 into a new main top. This will then become a change in trend price.
The minor trend is up. This is controlling the momentum.
The minor range is $1821.30 to $1878.10. Its retracement zone at $1849.70 to $1843.00 is currently being tested.
The short-term range is $1966.80 to $1821.30. Its retracement zone at $1894.10 to $1911.20 is potential resistance.
On the downside, the next major target is the long-term 50% level at $1787.30.
Daily Swing Chart Technical Forecast
The early price action on Wednesday suggests the direction of the April Comex gold futures contract will be determined by trader reaction to the Fibonacci level at $1843.00.
Bearish Scenario
A sustained move under $1843.00 will indicate the presence of sellers. If this move generates enough downside momentum then look for the selling to possibly extend into the minor bottom at $1826.10, followed by the main bottom at $1821.30.
If the main bottom at $1821.30 fails to hold then look for a possible acceleration into the major 50% level at $1787.30, followed by the November 30 main bottom at $1771.30.
Bullish Scenario
A sustained move over $1843.00 will signal the return of buyers. Overtaking the 50% level at $1849.70 will indicate the buying is getting stronger. If this move is able to generate enough upside momentum and a secondary higher bottom forms then the rally could extend into $1878.10.
For a look at all of today’s economic events, check out our economic calendar.
About the Author
James Hyerczykauthor
James is a Florida-based technical analyst, market researcher, educator and trader with 35+ years of experience. He is an expert in the area of patterns, price and time analysis as it applies to futures, Forex, and stocks.
Did you find this article useful?
Latest news and analysis


Advertisement