
Canadian Dollar Price Forecast: USD/CAD, CAD/JPY And EUR/CAD
A major, significant level of support came into play in USD/CAD a couple of weeks ago. I had highlighted this in an article around that inflection, as the pair had just run into the 50% marker of a very long-term major move at 1.2622.
A few days later, that support inflection had led into a morning star formation, often followed with the aim of bullish reversals, and this was combined with a falling wedge which will similarly be followed with aims of bearish reversals. Since then, buyers have been in-charge and have helped to prod the pair up to a fresh monthly high. But, there may be another item of resistance ahead, which I’ll look at in the next chart.
USD/CAD FOUR-HOUR PRICE CHART
(Click on image to enlarge)
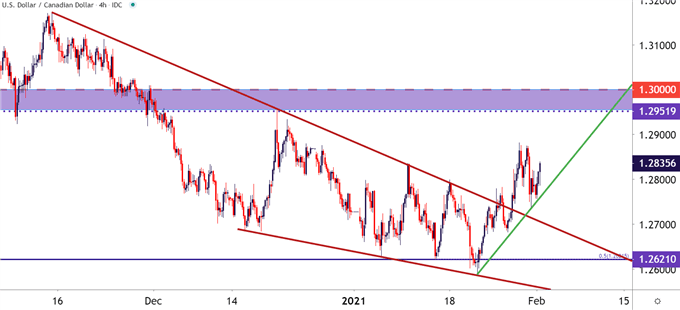
Chart prepared by James Stanley; USDCAD on Tradingview
Taking a step back on the chart, and there’s another item of resistance that’s recently come into play, and this is highlighted with the red trendline on the below chart. This trendline originates from the March high and connects with the October and November swing-highs. The projection from that trendline came into play last Thursday and held again through Friday.
This may be highlighting another falling wedge but this one of a longer-term variety. If bulls can push through here, the next obvious spot on the chart is the same support/resistance zone around 1.2952-1.3000 that’s been in-play since around the 2020 open.
USD/CAD DAILY PRICE CHART
(Click on image to enlarge)
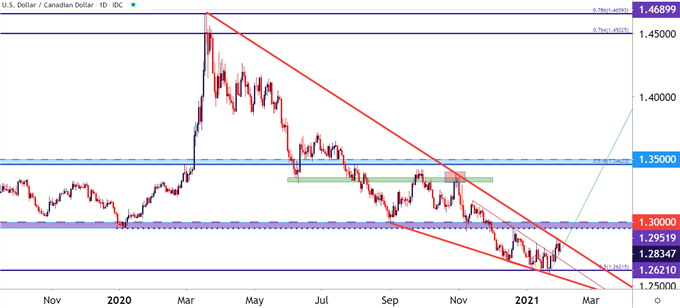
Chart prepared by James Stanley; USDCAD on Tradingview
POTENTIAL FOR A BREAK – LOOK TO THE US DOLLAR
The big question as to whether the above scenario results in another topside breakout will likely come from whether the US Dollar can elicit its own bullish breakout. The potential is there at this point, with a few high-impact events on the economic calendar, key of which is the Friday Non-farm Payrolls release, which drops at the same exact time as Canadian jobs numbers for the month of January are released (8:30 AM Eastern Time).
US DOLLAR EIGHT HOUR PRICE CHART
(Click on image to enlarge)
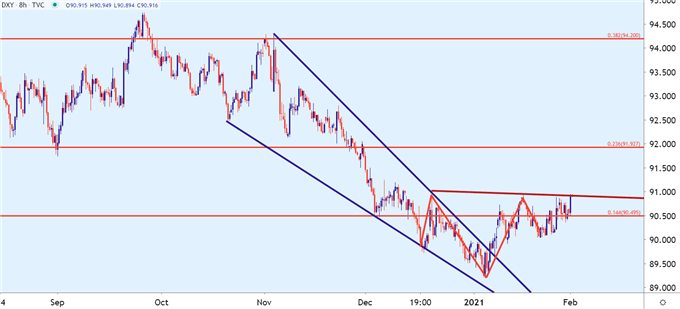
Chart prepared by James Stanley; USD, DXY on Tradingview
CAD/JPY Ascending Triangle Highlights Breakout Potential
For those that are looking on the long side of the Canadian Dollar, CAD/JPY may remain as compelling. The pair has continued to scratch back from the covid-fueled losses from earlier last year. It’s so far retraced approximately 76.4% of that move, and along the way the pair has formed an ascending triangle formation.
Such formations are marked by horizontal resistance to go along with a rising trendline to help mark support. That trendline is shown in Green below, and the horizontal resistance comes from the 23.6% retracement of the 2007-2009 major move.
Ascending triangle formations are often followed with the aim of bullish breakouts, looking for the horizontal resistance to finally give way after an increasing frequency of tests as supported by higher-low support. This can keep the door open for bullish potential, and for those looking at CAD-strength scenarios, this could remain an attractive market to follow.
CAD/JPY DAILY PRICE CHART
(Click on image to enlarge)
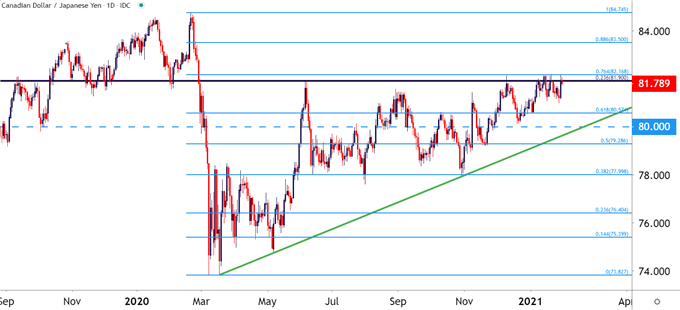
Chart prepared by James Stanley; CADJPY on Tradingview
EUR/CAD RESISTANCE FROM PRIOR SUPPORT AS SELLERS TRY TO TAKE-OVER
Another area that may remain of interest to CAD-bulls is EUR/CAD. The pair had come into the New Year holding on to gains from the spike in March. More recently, the Euro has started to see a bit more selling as the potential for some action out of the ECB has appeared to increase. Now, this might not be easy to see against the US Dollar as the US currency has been extremely weak of recent; but against the Canadian Dollar, that tide might be a little more clear given that the pair has recently pushed down to a fresh six-month-low.
Last week saw a pullback in that sell-off, and price action pushed back above a key Fibonacci level at 1.5455. But resistance remains as taken from the 23.6% retracement of the spike from early last year, and there’s also the prior support trendline that’s now shown as resistance.
EUR/CAD DAILY PRICE CHART
(Click on image to enlarge)
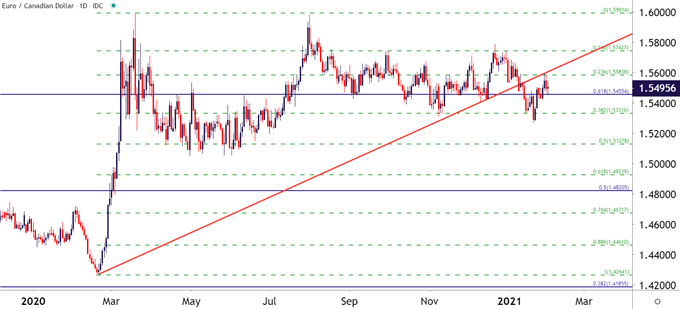
Chart prepared by James Stanley; EURCAD on Tradingview
Disclosure: See the full disclosure for DailyFX here.


