
Published
3 years ago on
February 19, 2021
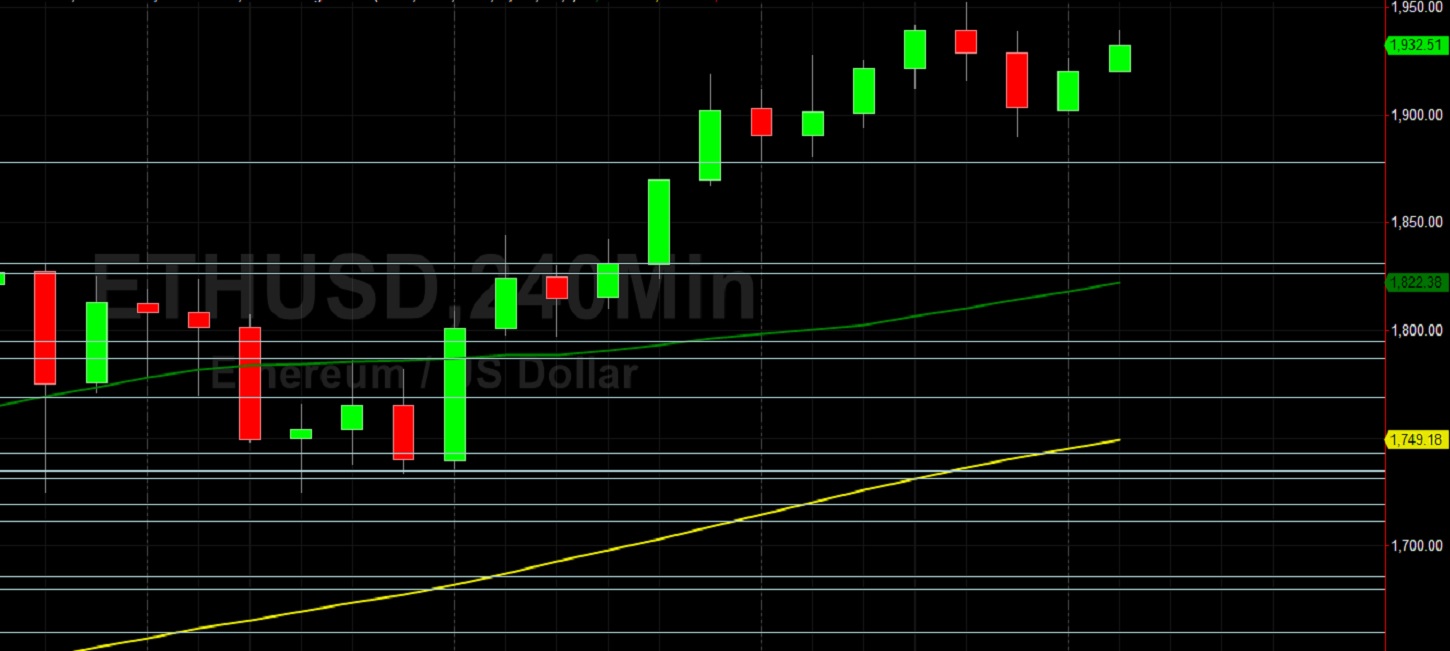
Ethereum (ETH/USD) expanded recent gains early in today’s North American session as the pair appreciated to the 1938.85 area after trading as low as the 1890 area during the Asian session, with the intraday low a pullback from the recent multi-year high around the 1951.99 area. Stops were elected above a major upside price objective around the 1930.40 level, an area related to buying pressure that originated around the 215.16 area. The intraday high represents a test of the 1957.36 area, an important upside price objective related to buying pressure around the 370.50 area. Traders remain focused on the psychologically-important 2000 level. Stops were recently elected above upside price objectives including the 1711.20, 1716.45, 1733.12, 1750.63, and 1805.21 levels, upside price objectives were technically significant on account of buying pressure that originated around the 148.08, 310.79, 439.77, and 123.72 areas. If ETH/USD is able to extend its upward gains, additional upside price objectives include the 1957.36, 2017.05, and 2080.48 levels.
Following the recent climb of ETH/USD to multi-year highs, traders are carefully watching potential areas of technical support including the 1607.29, 1473.08, 1364.62, 1256.15, 1221.94, and 1101.72 levels. If ETH/USD reverses recent gains and the psychologically-important 1000 figure cannot be held, technical traders will eye additional downside retracement areas including the 976.37, 954.16, 941.22, 917.03, 915.48, 902.24, and 895.33 levels. Traders are observing that the 50-bar MA (4-hourly) is bullishly indicating above the 100-bar MA (4-hourly) and above the 200-bar MA (4-hourly). Also, the 50-bar MA (hourly) is bullishly indicating above the 100-bar MA (hourly) and above the 200-bar MA (hourly).
Price activity is nearest the 50-bar MA (4-hourly) at 1822.34 and the 50-bar MA (Hourly) at 1892.14.
Technical Support is expected around 1473.08/ 1364.62/ 1256.15 with Stops expected below.
Technical Resistance is expected around 1957.36/ 2017.05/ 2080.48 with Stops expected above.
On 4-Hourly chart, SlowK is Bearishly below SlowD while MACD is Bullishly above MACDAverage.
On 60-minute chart, SlowK is Bullishly above SlowD while MACD is Bearishly below MACDAverage.
Disclaimer: This trading analysis is provided by a third party, and for informational purposes only. It does not reflect the views of Crypto Daily, nor is it intended to be used as legal, tax, investment, or financial advice.
Investment DisclaimerFoundation: A New Trading Paradigm
Bitrue to List Hummingbot Governance Token (HBOT)


