Published
3 years ago on
February 22, 2021
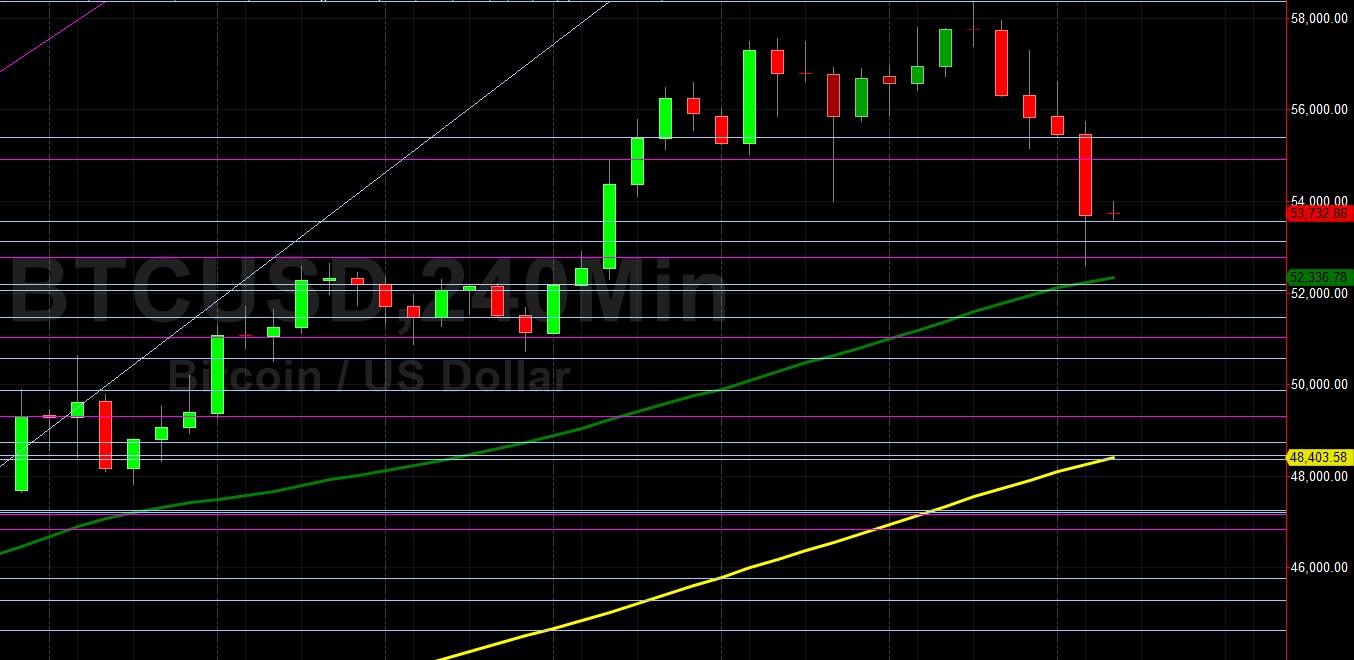
Bitcoin (BTC/USD) weakened early in today’s North American session as the pair depreciated to the 52610 area after trading as high as the 57949.95 area during the Asian session, with the intraday low representing a test of the 38.2% retracement of the recent appreciating range from 43706.86 to 58367, and the 50-bar 240-hour simple moving average. Traders pushed BTC/USD to the 58367 level during the surge, representing a new lifetime high. Stops were elected above many significant technical levels during the latest move to a new all-time high, including the 51732.54, 52505.24, 53194.95, 53276.47, 54400, 55266.17, 55715.92, 56761.65, and 57427.73 levels. These areas relate to historical buying pressure around the 17580, 21913.84, 27678, 16200, 27678, 21913.84, and 9819.83 levels. If BTC/USD continues its upward strength, traders will focus on upside price objectives including the 58896.80, 59724.81, 59792.54, 60,069.04, 60368.14, 60522.13, and 61064.65 levels.
Stops were elected below some technically-significant retracement levels during the pullback, including the 55393.74, 54907.21, 53554.36, 53125.31, 52766.83, and 52191.59 areas. Following the recent surge of BTC/USD, traders are carefully watching potential areas of technical support including the 51666.02, 51577.77, 50859.38, 50635.22, and 50274.19 levels. Additional areas of potential upside pressure include 49994.09, 48971.63, 48337.14, 46884.52, 45773.09, and 44961.99. Traders are observing that the 50-bar MA (4-hourly) is bullishly indicating above the 100-bar MA (4-hourly) and above the 200-bar MA (4-hourly). Also, the 50-bar MA (hourly) is bullishly indicating above the 100-bar MA (hourly) and above the 200-bar MA (hourly).
Price activity is nearest the 50-bar MA (4-hourly) at 52338.39 and the 100-bar MA (Hourly) at 54982.44.
Technical Support is expected around 54293.39/ 52511.49/ 51666.02 with Stops expected below.
Technical Resistance is expected around 51666.02/ 51577.77/ 50859.38 with Stops expected above.
On 4-Hourly chart, SlowK is Bearishly below SlowD while MACD is Bearishly below MACDAverage.
On 60-minute chart, SlowK is Bearishly below SlowD while MACD is Bearishly below MACDAverage.
Disclaimer: This trading analysis is provided by a third party, and for informational purposes only. It does not reflect the views of Crypto Daily, nor is it intended to be used as legal, tax, investment, or financial advice.
Investment DisclaimerFoundation: A New Trading Paradigm
Bitrue to List Hummingbot Governance Token (HBOT)