
Advertisement
Advertisement
Gold Price Futures (GC) Technical Analysis – Facing Important Challenge at $1819.00 to $1833.10
By:
The direction of the April Comex gold market into the close is likely to be determined by trader reaction to the pivot at $1807.80.

In this article:
Gold futures jumped nearly 2% to a near one-week high on Monday, as expectations for rising inflation triggered equity valuation concerns, fueling a short-covering rally in the precious metal. Meanwhile, another dip in the U.S. Dollar against a basket of major currencies lent further support.
Rising real yields and inflation concerns made equity valuations look more stretched in comparison and pushed investors toward non-interest bearing assets like gold, which is widely viewed as a hedge against inflation.
At 20:45 GMT, April Comex gold is trading $1808.60, up $31.20 or +1.76%.
Daily Swing Chart Technical Analysis
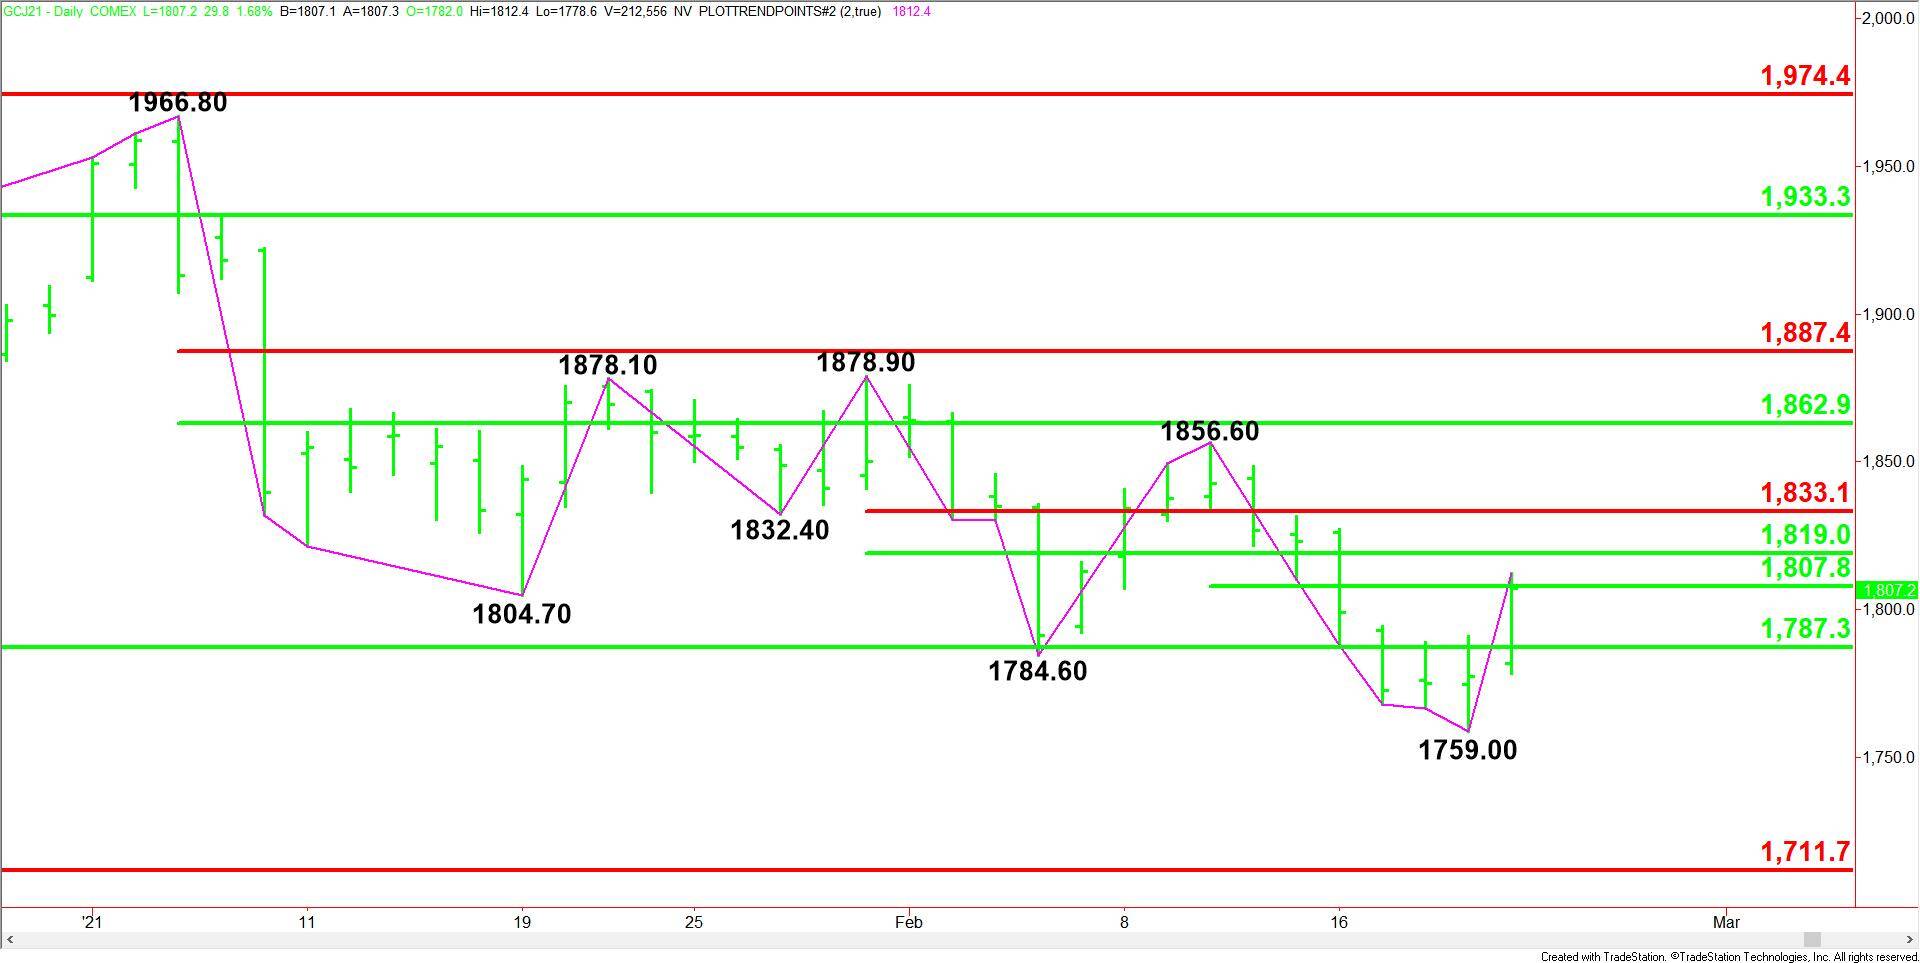
The main trend is down according to the daily swing chart. A trade through $1856.60 will change the main trend to up. A move through $1759.00 will signal a resumption of the downtrend.
The major support is a long-term retracement zone at $1787.30 to $1711.70. This zone stopped the selling at $1759.00 on Friday.
The minor range is $1856.60 to $1759.00. At the close, gold is straddling its 50% level at $1807.80.
The short-term range is $1878.90 to $1759.00. Its retracement zone at $1819.00 to $1833.10 is the next likely upside target.
The main range is $1966.80 to $1759.00. If the trend changes to up then look for the rally to possibly extend into its retracement zone at $1862.90 to $1887.40.
Daily Swing Chart Technical Forecast
The direction of the April Comex gold market into the close is likely to be determined by trader reaction to the pivot at $1807.80.
Bullish Scenario
A sustained move over $1807.80 will indicate the presence of buyers. This could trigger a move into $1819.00 to $1833.10. Since the main trend is down, look for sellers on the first test of this area.
Overcoming $1833.10 could trigger a surge into $1856.60 to $1862.90.
Bearish Scenario
A sustained move under $1807.80 will signal the presence of sellers. This could trigger a steep break into the major 50% level at $1787.30. If this fails then look for a possible retest of the main bottom at $1759.00.
For a look at all of today’s economic events, check out our economic calendar.
About the Author
James Hyerczykauthor
James is a Florida-based technical analyst, market researcher, educator and trader with 35+ years of experience. He is an expert in the area of patterns, price and time analysis as it applies to futures, Forex, and stocks.
Did you find this article useful?
Latest news and analysis


Advertisement