
Advertisement
Advertisement
Ethereum, Litecoin, and Ripple’s XRP – Daily Tech Analysis – February 23rd, 2021
By:
It's a bearish start to the day for the majors. A move back through early highs would be needed to avoided another broad-based crypto sell-off.

Ethereum
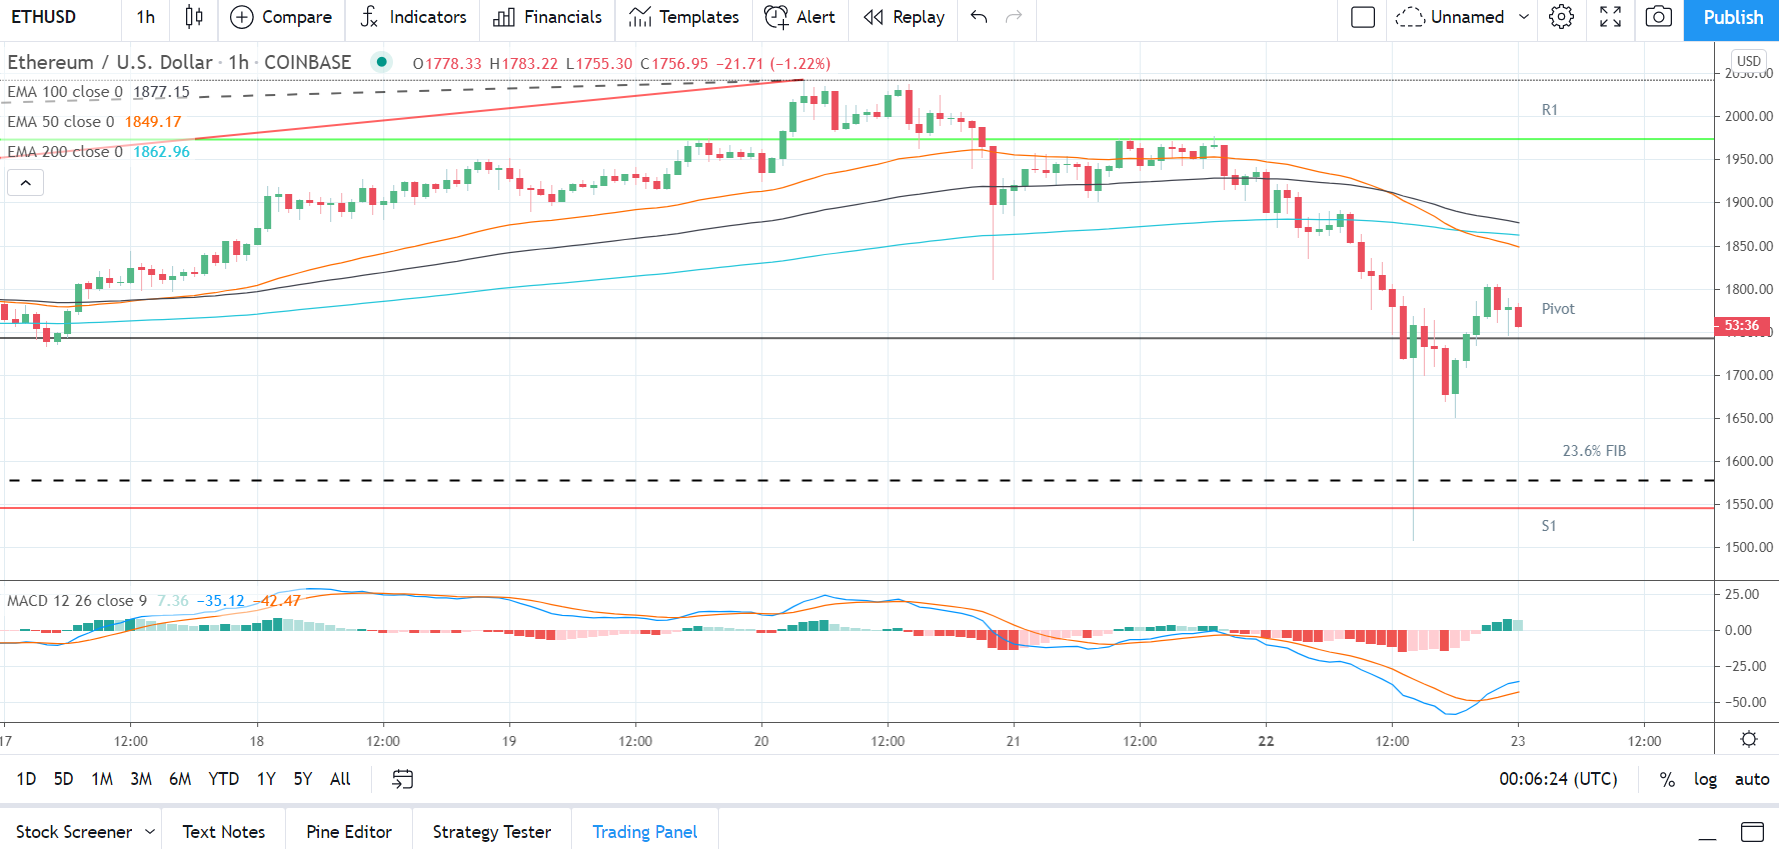
Ethereum slid by 8.11% on Monday. Reversing a 1.07% gain from Sunday, Ethereum ended the day at $1,778.66.
A mixed start to the day saw Ethereum rise to an early morning intraday high $1,938.95 before hitting reverse.
Falling short of the first major resistance level at $1,980, Ethereum slid to an early afternoon intraday low $1,508.35.
The sell-off saw Ethereum fall through the through the day’s major support levels and the 23.6% FIB of $1,579.
Finding late support, however, Ethereum broke back through the 23.6% FIB and the third major support level at $1,749 to end the day at $1,770 levels.
At the time of writing, Ethereum was down by 1.22% to $1,756.95 A mixed start to the day saw Ethereum rise to an early morning high $1,783.22 before falling to a low $1,755.30.
Ethereum left the major support and resistance levels untested early on.
For the day ahead
Ethereum would need to avoid a fall through the pivot level at $1,742 to support a run at the first major resistance level at $1,976.
Support from the broader market would be needed, however, for Ethereum to break back through to $1,900 levels.
Barring an extended crypto rally, the first major resistance level and Monday’s high $1,938.95 would likely cap any upside.
In the event of an extended crypto rally, Ethereum could test the second major resistance level at $2,173.
Failure to avoid a fall through the $1,742 pivot would bring the 23.6% FIB of $1,579 and the first major support level at $1,545 into play.
Barring another extended sell-off, however, Ethereum should steer clear of the second major support level at $1,311.
Looking at the Technical Indicators
First Major Support Level: $1,545
Pivot Level: $1,742
First Major Resistance Level: $1,976
23.6% FIB Retracement Level: $1,528
38.2% FIB Retracement Level: $1,251
62% FIB Retracement Level: $804
Litecoin
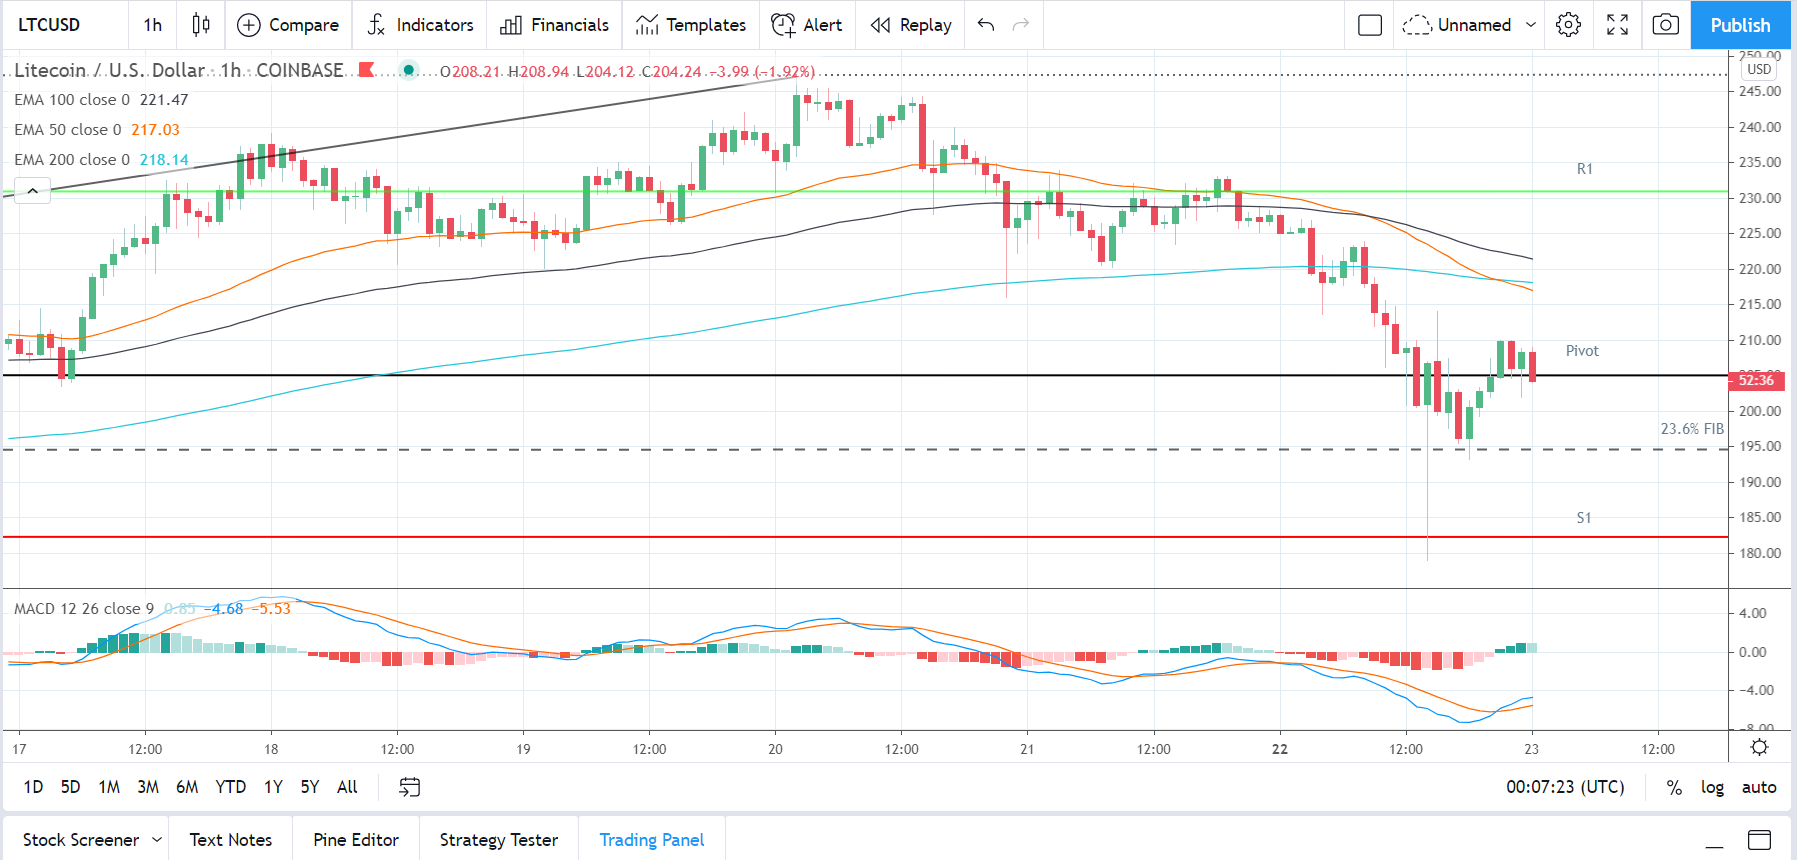
Litecoin slid by 8.50% on Monday. Reversing a 0.22% gain from Sunday, Litecoin ended the day at $208.23.
It was a bearish start to the day. Litecoin slid from an early morning intraday high $227.72 to an early afternoon intraday low $179.02.
The sell-off saw Litecoin fall through the day’s major support levels and the 23.6% FIB of $195.
Finding late support, however, Litecoin broke back through the third major support level at $199.85.
More significantly, Litecoin also broke back through the 23.6% FIB of $195 to wrap up the day at $208 levels.
At the time of writing, Litecoin was down by 1.92% to $204.24. A mixed start to the day saw Litecoin rise to an early morning high $208.94 before falling to a low $204.12.
Litecoin left the major support and resistance levels untested early on.
For the day ahead
Litecoin would need to move back through the $204.99 pivot level to support a run at the first major resistance level at $230.96.
Support from the broader market would be needed, however, for Litecoin to break back through to $220 levels.
Barring an extended crypto rally, the first major resistance level and Monday’s high $227.72 would likely cap any upside.
In the event of an extended breakout, Litecoin could test resistance at $240 before any pullback. The second major resistance level sits at $253.69.
Failure to move back through the $204.99 pivot level would bring the 23.6% FIB of $195 and the first major support level at $182.26 into play.
Barring another extended sell-off, Litecoin should steer well clear of the second major support level at $156.26. The 38.2% FIB of $163 should limit the downside in the event of a sell-off.
Looking at the Technical Indicators
First Major Support Level: $182.26
Pivot Level: $204.99
First Major Resistance Level: $230.96
23.6% FIB Retracement Level: $191
38.2% FIB Retracement Level: $159
62% FIB Retracement Level: $108
Ripple’s XRP
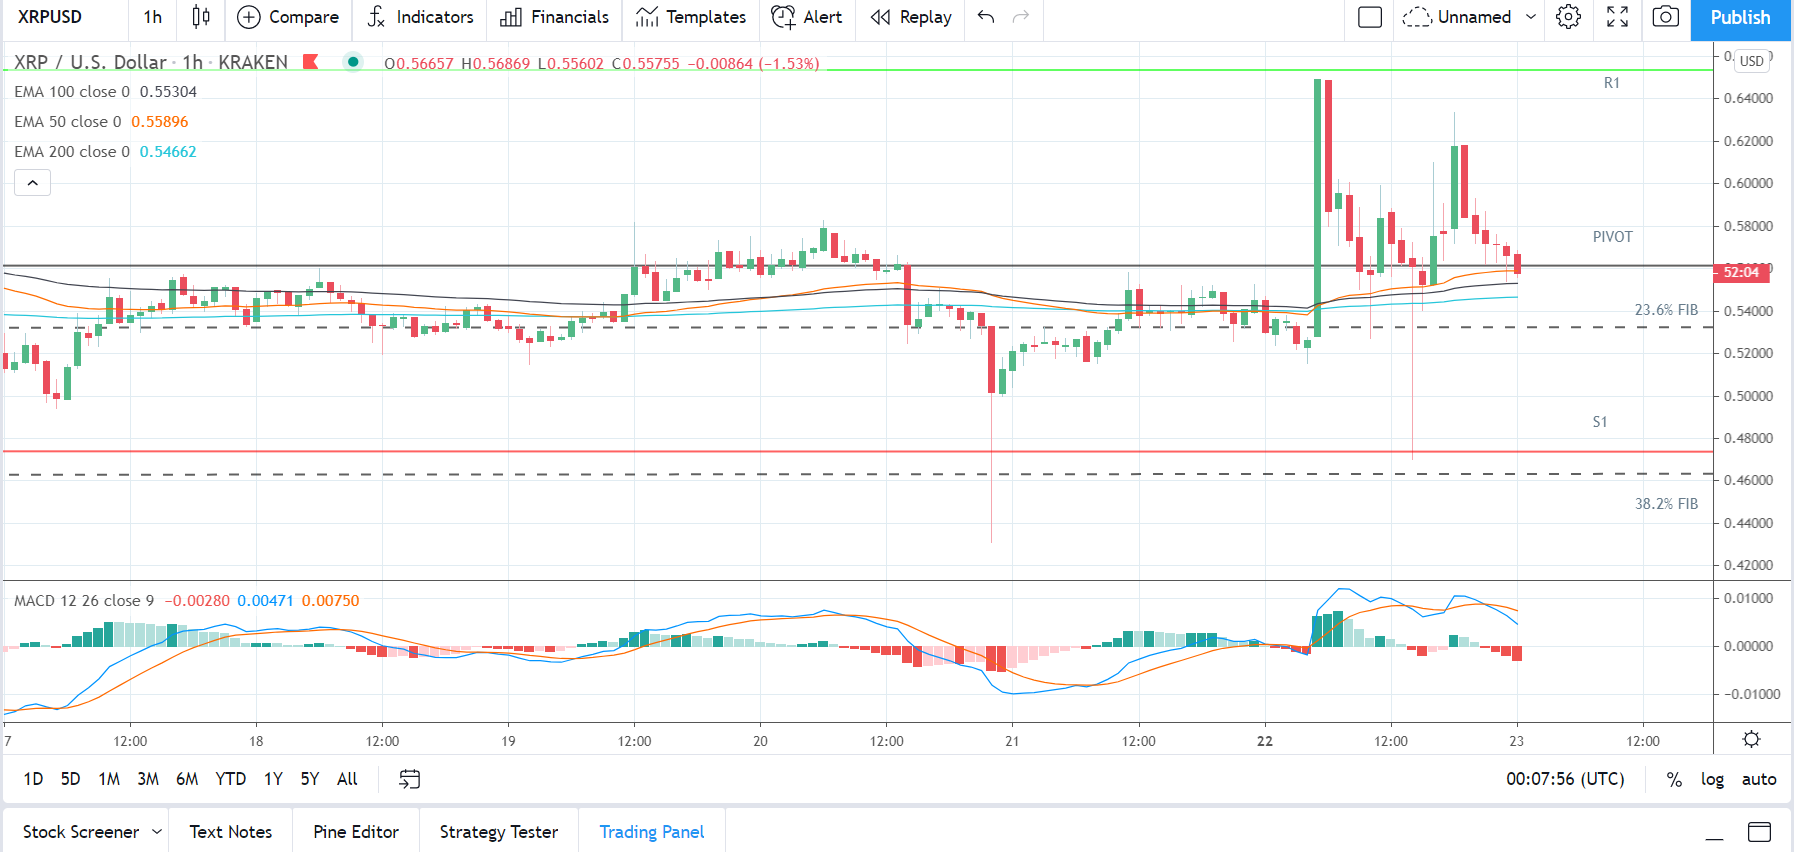
Ripple’s XRP rose by 3.87% on Monday. Following on from a 6.47% rally from Sunday, Ripple’s XRP ended the day at $0.56619.
A mixed start to the day saw jump to a mid-morning intraday high $0.64919.
Ripple’s XRP broke through the day’s major resistance levels before hitting reverse.
Going into the 2nd half of the day, Ripple’s XRP slid to an early afternoon intraday low $0.47000.
Ripple’s XRP fell through the first major support level at $0.5132 and the second major support level at $0.4813.
More significantly, Ripple’s XRP fell back through the 23.6% FIB of $0.5320 before revisiting $0.63 levels late in the day.
Ripple’s XRP broke back through the first major resistance level at $0.5677 and the second major resistance level at $0.5903.
A bearish end to the day, however, saw Ripple’s XRP fall back through the major resistance levels to end the day at $0.566 levels.
At the time of writing, Ripple’s XRP was down by 1.53% to 0.55755. A mixed start to the day saw Ripple’s XRP rise to an early morning high $0.56869 before falling to a low $0.55602.
Ripple’s XRP left the major support and resistance levels untested early on.
For the day ahead
Ripple’s XRP will need to move back through the $0.5618 pivot level to bring the first major resistance level at $0.6536 into play.
Support from the broader market would be needed, however, for Ripple’s XRP to break out from Monday’s high $0.64919.
Barring an extended crypto rally, the first major resistance level would likely cap any upside.
In the event of an extended rally, Ripple’s XRP could test resistance at $0.70 before any pullback. The second major resistance level sits at $0.7410.
Failure to move back through the $0.5618 pivot would bring the 23.6% FIB of $0.5320 and the first major support level at $0.4744 into play.
Barring another extended sell-off, however, Ripple’s XRP should steer well clear of the second major support level at $0.3826. The 38.2% FIB of $0.4632 should limit the downside.
Looking at the Technical Indicators
First Major Support Level: $0.4744
Pivot Level: $0.5618
First Major Resistance Level: $0.6536
23.6% FIB Retracement Level: $0.5320
38.2% FIB Retracement Level: $0.4632
62% FIB Retracement Level: $0.3521
Please let us know what you think in the comments below.
Thanks, Bob
About the Author
Bob Masonauthor
With over 20 years of experience in the finance industry, Bob has been managing regional teams across Europe and Asia and focusing on analytics across both corporate and financial institutions. Currently he is covering developments relating to the financial markets, including currencies, commodities, alternative asset classes, and global equities.
Did you find this article useful?
Latest news and analysis


Advertisement