
10 Industries In Secular Decline
At Gradient Analytics, we spend a significant amount of our time analyzing financial statements and looking for accounting irregularities (or shenanigans) and signs of misleading “financial engineering.” When we find a firm employing aggressive accounting tactics, we often notice that they operate in industries that are undergoing significant change or are in secular decline. This makes sense, considering that companies in such industries tend to exhibit declining top-and bottom-line growth rates. By applying aggressive accounting assumptions, management can temporarily juice both sales and earnings growth.
However, just because a company operates within an industry in secular decline does not necessarily mean it will struggle to grow. The stronger players often can accumulate greater market share and prosper, while the weaker players lose market share and fade away.
In this article, I provide a cursory overview of ten industries that we believe are in secular decline and opine on some of their constituents – highlighting a few that we think may thrive and a few that we think will struggle.
Industries that we believe are in secular decline:
1. Movie theaters
2. Baby diapers
3. Natural gas utilities
4. Milk beverages
5. Textbooks
6. Bank branches
7. On-premises IT infrastructure and services
8. Set-top boxes (i.e., cable boxes)
9. Life insurance
10. Automotive transmissions
Let’s briefly explore each individually.
1. Movie theaters:
Movie theaters have undoubtedly struggled following COVID-19 restrictions that kept doors closed to customers and pushed back the release dates of major films into 2021 and 2022. However, even before the pandemic, movie theater attendance had been trending down. According to the National Association of Theatre Owners (the other NATO), admissions into movie theaters in the U.S and Canada have been steadily declining over the last decade, as shown below in Chart 1. However, despite the decline in attendance, operators such as AMC Entertainment Holdings (AMC) and Cinemark Holdings (CNK) have reported annual YOY sales growth in almost every year between 2009 and 2019.
Chart 1. U.S. and Canada Movie Theater Admissions and Average Ticket Prices 2009-2019
(Admissions in millions)
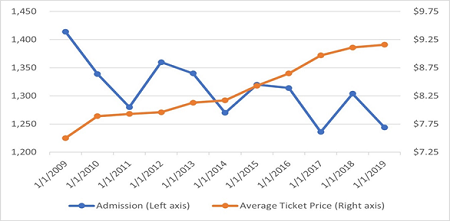
A driver of topline growth for AMC and CNK undoubtedly has been the rise in the average movie ticket price. For example, the average U.S. ticket price has increased 22% over the past decade, which has helped offset the 12% decline in attendance volumes over the same time period. Unfortunately, we believe that this trend ultimately is unsustainable since raising ticket prices likely will lead to a further decrease in attendance. Movie theater operators such as AMC and CNK likely will need to reposition operations to continue to grow their top line going forward. One approach has been to invest in luxury movie theaters, which supports higher ticket prices.
Notably, a firm like Barco N.V. (BAR:BR), which sells cinema projectors, is likely to struggle to grow as movie theater locations consolidate in response to declining attendance. (Note: Gradient has an active short thesis on Barco based on fundamental weakness and multiple earnings quality concerns detailed in our original coverage-initiation Alert and recent post-earnings Research Note, both of which are available to Gradient’s research subscribers.)
2. Baby diapers:
The U.S. has exhibited a long trend of declining births and fertility rates. As shown below in Chart 2, baby births declined 1.0% YOY in 2019, marking the fifth year in a row that baby births have declined on a YOY basis. This was also the lowest level of baby births since 1985. Moreover, the general fertility rate (number of births per 1,000 women aged 15-44) in the US declined 2.0% YOY to 58.3 births per 1,000 in 2019, a record low.
Chart 2. Live Births and General Fertility Rates: U.S. 1990-2019
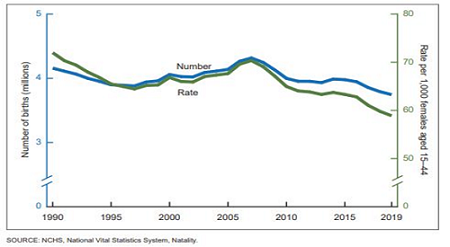
The declining number of births in the U.S. also has steepened following the COVID-19 pandemic. Economists at the Brookings Institute estimated that there will be between 300,000 to 500,000 fewer baby births in 2021 (down about 8% YOY) due to the impact of the pandemic. The economic loss and general uncertainty will lead to a material decline in births, according to economists. Another study analyzed Google search trends for pregnancy-related terms such as “ClearBlue” (a pregnancy test), “ultrasound,” and “morning sickness” and found that these searches have all fallen since the pandemic began. Following this analysis, the authors project a staggering 15% decline in births in 2021.
We note that Kimberly-Clark Corporation (KMB), maker of Huggies Diapers, also anticipates births to decline in 2021 but at a slower rate than is forecasted by the aforementioned studies. Looking ahead, KMB likely will need to increase the prices of their baby-related products to offset the decline in infant births.
3. Natural gas utilities:
Natural gas utilities have come under pressure recently as municipalities have banned new gas hookups in a bid to fight climate change. Beginning in July 2019, Berkeley, California was the first local government to prohibit new natural gas infrastructure construction and other liberal-leaning localities have since followed suit. For instance, Seattle's mayor recently introduced legislation that bans natural gas heating in new buildings. However, conservative-leaning states have taken preemptive measures to prevent further natural gas bans and have introduced legislation that prohibits local governments from blocking access to natural gas, as shown below in Chart 3.
Chart 3. States Advancing or Prohibiting Building Gas Bans and Electrification Codes
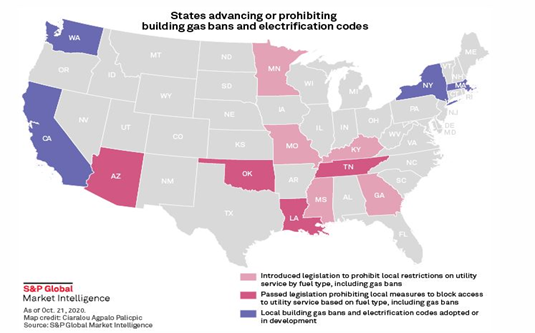
Considering that natural gas already accounts for the largest source of electricity generation in the US at 38.4%, there is a risk going forward that natural gas will struggle to grow its market share – although it may continue to take share from coal, which accounts for 23.4% of electricity generation. However, renewables (which currently accounts for 17.6%) – and perhaps nuclear (currently 19.6%) – may be poised to continue taking market share from fossil fuels as governments take steps to address climate change. While this may be a negative long-term trend for natural gas utilities, those located in fast-growing population regions like Arizona and Nevada [e.g., Southwest Gas Holdings (SWX)] may be able to buck the trend in the near term.
4. Milk beverages:
The consumption of fluid milk has been declining for decades in the United States. As shown below in Chart 4, per capita consumption of fluid milk has declined YOY for 10 consecutive years. Furthermore, the pace of the decline has recently steepened¸ as the 2.8% YOY decline in fluid milk consumption in 2019 was steeper than the 2.7%, 2.6%, and 1.3% YOY declines in 2018, 2017, and 2016, respectively. In fact, the last time fluid milk consumption increased was in 1985 when consumption per capita increased 1.3% YOY.
Chart 4. Per Capita Consumption of Fluid Milk in the United States 1999-2019
(in pounds per person)
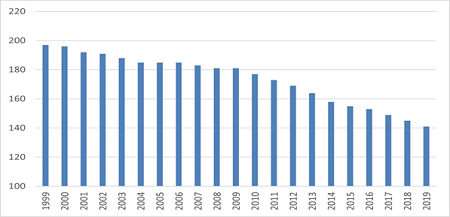
However, the decline in fluid milk consumption has been more than offset by a dramatic rise in consumption of milk byproducts, such as cheese, butter, and yogurt such that the aggregate consumption of fluid milk and milk byproducts actually increased by 1.0% YOY in 2019 after increasing 0.2% in 2018. For example, Saputo Inc (SAP:TO), a Canadian dairy producer, explained during its August 2020 Investor Day Presentation that the firm plans to make a significant investment to grow its cheese production capacity in response to changing consumer demand. Nevertheless, it remains to be seen whether increasing demand for cheese can continue to fully offset a sustained decline in fluid milk consumption going forward.
5. Textbooks:
The textbook industry has undergone significant change in recent years with the introduction of textbook rentals provided by Chegg (CHGG) and Amazon (AMZN). Textbook rentals have helped cap the accelerating price increases in textbooks by providing an alternative to paying full price. Still, college textbook prices increased 88% between 2006 and 2016, rapidly outpacing price increases in college tuition and housing. However, data from Campusbooks.com, a leading textbook comparison website, shows that textbook prices have fallen 26% since 2017.
Textbook publishers like Pearson plc (PSO and PSON:LN) have responded to the rise of the secondary textbook rental market by migrating away from print in favor of digital eTextbooks instead, which have no secondary value. For example, PSON’s CEO stated on the firm’s October 2020 Conference Call that the company plans to sell around 30% fewer print-only textbooks while selling 9% more eTextbooks, albeit at a lower price point. Looking forward, textbook publishers likely will increasingly favor eTextbooks to combat the growth of the secondary rental market. However, this likely will pressure textbook publishers topline since eTextbooks usually have a lower price point. Textbook publishers may have to find new sources of revenue to offset the decline in sales as higher-priced print editions are phased out. Furthermore, the rise of open textbook libraries, which are free to access, may further pressure textbook publisher’s business models. Although a move to eTextbooks may improve margins due to lower production costs, it remains to be seen whether the cost savings can fully offset the lower price points.
6. Bank branches:
While banks have been consolidating into larger and larger institutions (think “Too Big to Fail”), walk-in bank branches are becoming less and less important. According to S&P Global, during 2020 U.S. banks and thrifts closed 3,324 branches and opened 1,040, with Pennsylvania, Illinois, and California the leading states for bank branch closures. Moreover, net branch closings accelerated into the end of 2020, indicating that the trend likely has persisted into 2021. With the rise of digital banking, bank branches are becoming less of a necessity and the closures help bolster operational efficiency. The closing of bank branches likely will lead to improved earnings at U.S. banks as the fixed costs of operating a branch are removed from the financial statements. However, this still may come at some cost, as customer satisfaction and loyalty tends to decline as customers transition from high-touch branches to less-personal digital banking relationships, according to Deloitte.
Interestingly, bank branch closures may benefit ATM manufacturers like NCR Corp (NCR) and Diebold (DBD). This is because banks tend to expand their ATM network and/or cover fees to use an out-of-network ATM to make up for their smaller footprint. This trend is apparent in newly released data from the Federal Reserve’s triennial payments study, which showed that cash withdrawal volumes from “on-us” ATMs (i.e., those owned by the account holder’s bank) have remained relatively stable since 2003 despite a rise in bank branch closures and declining use of cash. This could mean that banks are replacing branches with ATMs. Going forward, it will be interesting to see whether continued bank branch closures provide a tailwind or a headwind to ATM manufacturers.
7. On-premises IT infrastructure and services:
There has been a tectonic shift to the cloud in recent years. This is clearly evidenced by the growth rates of the top cloud providers, such as Amazon Web Services (AWS), Google Cloud, and Microsoft Azure, as illustrated below in Chart 5. For example, AWS reported a 30% YOY rise in TTM sales in 2020 after reporting a 37% YOY growth rate in 2019. Google Cloud reported TTM sales growth of 46% YOY to $13.1 billion for 2020, while Microsoft Azure reported that it grew 50% YOY in its most recent quarter (01/26/21). Clearly, enterprises are shifting resources away from on-premises infrastructure and investing those resources in the cloud. This tectonic shift has created many winners and losers, much of which is still playing out.
Chart 5. Quarterly YOY Growth Rates for Various Cloud Providers

A company that appears stuck in the crosshairs of the cloud migration is Splunk Inc (SPLK), an infrastructure monitoring software provider that was developed primarily for on-premises use. The company has been the dominant on-premises software provider and counts nearly all the Fortune 100 companies as a customer. However, with the migration to the cloud, SPLK has had to reposition itself, and the firm has completed a series of tuck-in acquisitions to further build out its cloud technology stack. Unfortunately, the firm is now competing with cloud-native software providers like DataDog (DDOG) that offer software built specifically for the cloud.
The combination of rising competition and changing market landscape helps explain the rapid decline in SPLK’s quarterly bookings, which most recently declined by 38% YOY. While SPLK’s management team has attributed the decline in bookings to transitory trends, the rapid change in its industry calls into question whether the decline in bookings is representative of a longer-term trend. (Note: Gradient has an active short thesis on SPLK based on fundamental concerns and multiple earnings quality issues detailed in our original coverage-initiation Alert and recent post-earnings Research Note, both of which are available to Gradient’s research subscribers.)
8. Set-top boxes (i.e., cable boxes):
Set-top boxes are computers that transform data sent via cables into visual and audio data that can be displayed on a TV screen. Since consumers have increasingly adopted streaming services in place of cable television, demand for set-top boxes has materially declined. This decline has been accentuated by new forms of media that do not require a set-top box to access. For example, game consoles like the Sony (SNE) PlayStation or Microsoft (MSFT) Xbox can be used to stream media.
However, the growing demand for broadband, which is largely driven by streaming services, may provide support for set-top boxes going forward. Capacity upgrades implemented by cable operators like Comcast (CMCSA) and Charter Communications (CHTR) may lead to a new upgrade cycle in set-top boxes. This is because consumers will need to purchase a set-top box that supports the higher capacity standards, such as DOCSIS 3.1. However, the concurrent build-out of 5G, which provides faster internet access to consumers’ mobile devices, may take a share from broadband demand. While the growth in bandwidth demand appears insatiable, how consumers access bandwidth will have a material impact on certain industries going forward. It remains to be seen if broadband access provided by cable operators (and accessed via set-top boxes) is usurped by 5G bandwidth going forward. As shown below in Chart 6, Cisco (CSCO) anticipates 5G speeds will be 13x faster than the average mobile connection by 2023. If consumer bandwidth demand is fully serviced by 5G, this may reduce demand for set-top boxes in the future.
Chart 6. Global Mobile Average Speeds by Network Type

Source: Cisco Annual Internet Report, 2018–2023
9. Life insurance:
The traditional role of life insurers is to insure against idiosyncratic risks with offerings like life, P&C, and health insurance and annuities. However, with ultra-low interest rates for over a decade, the incentives to buy whole life insurance as an investment have diminished. As a result, life insurers have increasingly offered a riskier financial product to attract investors: minimum return guarantees. These products are often sold via variable annuities, which include a mutual fund with minimum return guarantees over long investment horizons. These products are high risk to the insurer but have helped offset the decline in demand for life insurance products in recent years. Attesting to the change in life insurer's business models, variable annuities have become the largest category of life insurer liabilities, larger than traditional annuities and life insurance. Unfortunately, these minimum return guarantees can lead to substantial losses during periods of economic uncertainty which was laid bare during both the Financial Crisis and the COVID-19 pandemic. For example, Hartford Financial Services Group Inc (HIG) lost $2.6 billion in 2008 due to investment losses and the costs of minimum guarantees on its variable annuities and later had to accept a TARP bailout.
The risk mismatch between an insurer’s general account assets and minimum return guarantees leads to the negative duration and negative convexity for an insurer’s balance sheet, according to a working paper from the University of Chicago. Moreover, the authors of the paper conclude that persistently low-interest rates, widening credit spreads, and increased volatility, will challenge insurers’ balance sheets for the foreseeable future. We suspect that life insurance providers will have to continue to take on increased risks to offset these unfavorable headwinds. The embedded risk of these products was pronounced during the 2020 market selloff as variable annuity insurers saw drawdowns upwards of 70% during the market turmoil, as shown below in Chart 7.
Chart 7. Equity Returns for U.S. Life Insurance Sector During COVID-19 Crisis
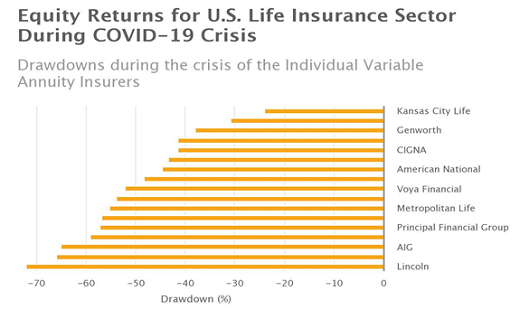
Source: Here.
10. Automotive transmissions:
With the rise of electric vehicles, certain automotive components are no longer needed, such as transmissions. While an internal combustion vehicle has multiple gears for different speeds, electric vehicles typically have a single-speed transmission. This has been a trend that Allison Transmission Holdings (ALSN) has anticipated for multiple years. ALSN designs manufactures and sells transmissions for commercial vehicles. In response to an increasingly electric auto market (as illustrated below in Chart 8 from the IEA), the company recently launched a zero-emissions electric axle for heavy-duty trucks. While ALSN may be able to capture rising demand for electric axles, this likely will come at the expense of declining demand for combustion engine axles and transmissions, which may pressure ALSN’s ability to grow its topline going forward.
Chart 8. Global Electric Car Sales by Key Markets, 2010-2020
(Units in millions, left axis)
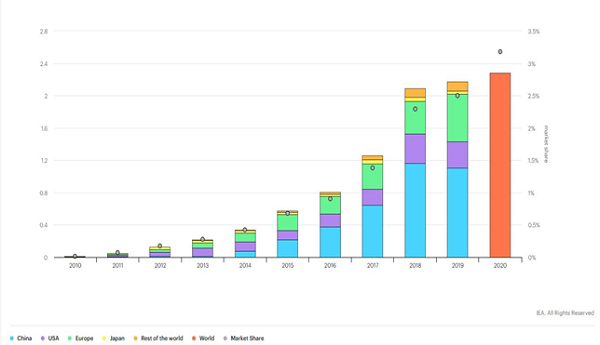
Source: Here.
ALSN also explained during its October 2020 Conference Call that it anticipates the content it provides to fully integrated commercial electric vehicles could range from 3x to 10x that of a conventional transmission for a commercial vehicle. This may help offset the decline in demand for transmissions going forward but likely will require ALSN to reorganize its manufacturing facilities. Undoubtedly, ALSN is operating in a market undergoing rapid change and it is not yet clear if the transition to electric axles will benefit or hurt the company.
In summary:
The global economy continues to undergo accelerating change that impacts not only our lives but also our investments. Some industries are in secular growth while others are in secular decline. But regardless, there will be winners and losers among the individual companies in any industry. Winners will be those that can either take market share or dominate a growing niche within an otherwise declining industry, while losers will be those that can do neither. The analyst team at Gradient Analytics maintains the expertise to uncover aggressive accounting practices that corporate executives around the world may exploit to present a more favorable (and perhaps misleading) picture of a given firm’s underlying economic condition.
Disclosure: At the time of this writing, the author held no positions in the securities mentioned.
Disclosure: Author has no positions in stocks or ETFs mentioned.


