
British Pound Price Forecast: Will Resistance Stop The GBP/USD Rally?

The British Pound has continued to display strength in recent sessions, even as the US Dollar made progress against some major counterparts last week. Now that broader USD weakness has returned, however, GBP/USD may look to extend higher still as the fundamental landscape has undergone little change and commentary from Fed Chairman Jerome Powell might even give way to deeper losses. As a result, GBP/USD may take aim at longstanding resistance.
As GBP/USD moves to its highest level in nearly three years, topside barriers have become harder to identify. That being said, the next major level of resistance might be derived from price action in early 2018. Ranging from 1.4298 to 1.4377 the zone coincides with a series of swing highs from January and April 2018. With that in mind, traders with bullish exposure may consider raising protective stops or reducing exposure around the area in the event bears make a stand.
GBP/USD PRICE CHART: DAILY TIME FRAME (JANUARY 2018 – FEBRUARY 2021)
(Click on image to enlarge)
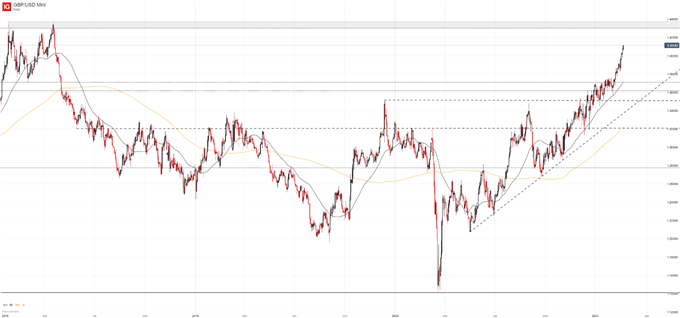
Nevertheless, weakness derived from overhead resistance may be short lived as there is currently little evidence to suggest GBP/USD will reverse lower over the longer-term in my opinion. Many of the shackles from months of Brexit uncertainty have been removed and it would appear as though Cable is making up for lost time.
Further still, IG client sentiment data reveals retail traders are overwhelming short GBP/USD. Since we typically take a contrarian view to crowd sentiment, IGCS data may suggest the pair will continue to climb in the weeks ahead.
Disclosure: See the full disclosure for DailyFX here.


