Join Our Telegram channel to stay up to date on breaking news coverage
Bitcoin (BTC) Price Prediction – February 25
The Bitcoin price is trading below $50,000 against USD and the coin is likely to climb steadily with a few downward moves.
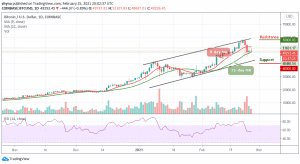
BTC/USD Long-term Trend: Bullish (Daily Chart)
Key levels:
Resistance Levels: $58,000, $60,000, $62,000
Support Levels: $40,000, $38,000, $36,000

It is safe to say that BTC/USD has been turbulent in recent days, after tight trading for a few weeks with relatively low volatility. Early today, the Bitcoin price rose sharply by moving above the resistance level of $51,000 against the US dollar. The coin even exceeded the $52,000 level before correcting lower. At the moment, the price is declining and is moving close to the 21-day moving average at $48,500.
Where is BTC Price Going Next?
A crucial uptrend could form above the moving averages, with support close to $48,000 on the daily chart. However, if the decline occurs below the lower boundary of the channel, the price could extend its downward correction to the $46,000 level and any other loss could possibly push the price of Bitcoin to the support level of $44,000.
More so, at the time of writing, the Bitcoin price had dropped to $48,667. A further drop may cause the market to reach the critical supports at $40,000, $38,000, and $36,000. In other words, if the market were to rebound, we could see the next buying pressure towards the resistance levels of $58,000, $60,000, and $62,000. Nevertheless, BTC still maintains a bullish trend on the daily chart, with the RSI (14) moving sideways.
BTC/USD Medium-Term Trend: Ranging (4H Chart)
Looking at the 4-hour chart, the resistance at the $52,000 was too heavy for the bulls to overcome. So the price is seriously struggling in a consolidation mode, which has made BTC remain indecisive over the past few hours now. The resistance levels to watch are 54,000 and above.
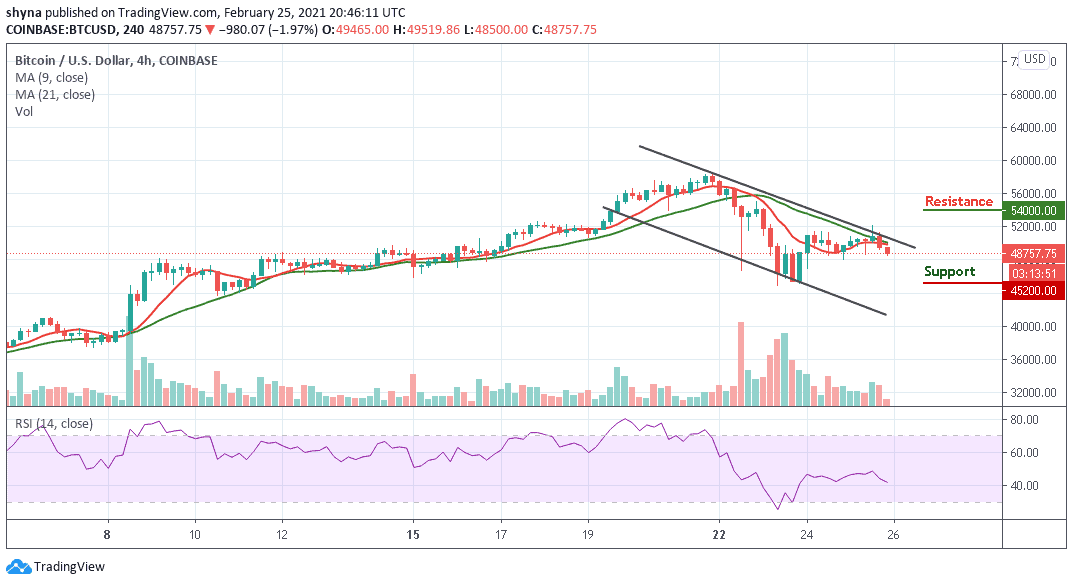
However, Bitcoin’s price is still roaming around $48,757 and we can see that the bullish supply has been slowly turning heavy in the market, while the bears are trying to drag the price below $48,000 support. Meanwhile, the $45,200 and below may come into play if BTC breaks the mentioned support. The technical indicator RSI (14) is moving to cross below the 40-level, suggesting more bearish signals.
Join Our Telegram channel to stay up to date on breaking news coverage