- USD/CHF gained strong positive traction for the second straight session on Wednesday.
- Bullish oscillators on the daily chart support prospects for a further appreciating move.
- A move towards 200-DMA, around the 0.9145 region, now looks a distinct possibility.
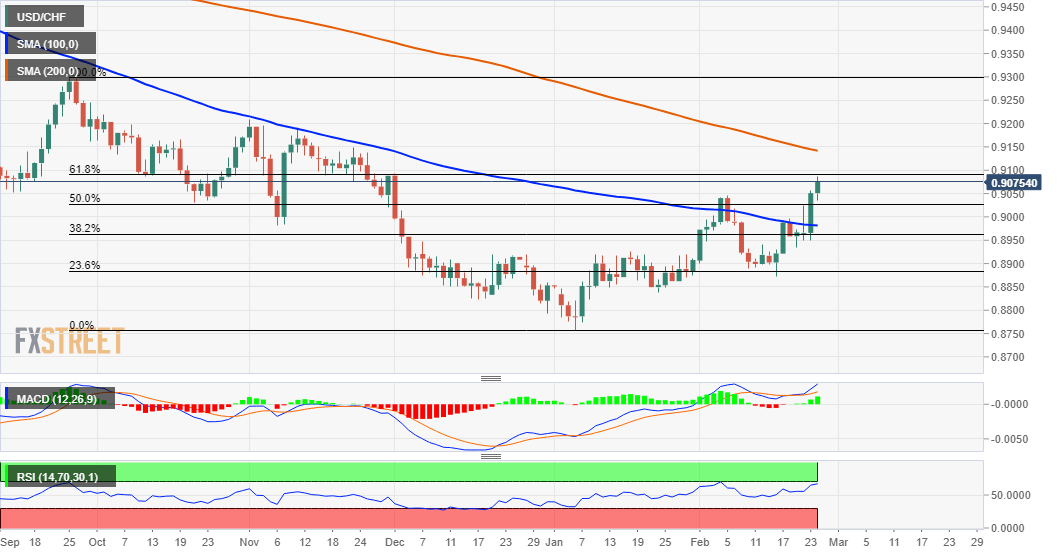
The USD/CHF pair added to the previous day's strong move up and gained some follow-through traction for the second consecutive session on Wednesday. The momentum pushed the pair to the highest level since early December 2020, around the 0.9085 area.
The mentioned region marks the 61.8% Fibonacci level of the 0.9297-0.8758 downfall, which if cleared will set the stage for additional gains. The USD/CHF pair might then surpass the 0.9100 mark and aim to challenge 200-day SMA, around the 0.9145 region.
Meanwhile, technical indicators on the daily chart are holding in the positive territory and still far from being in the overbought zone. However, RSI on the 4-hourly chart is already flashing overbought conditions and warrants some caution for bulls.
This seemed to be the only factor holding bulls from placing fresh bets. Hence, it will be prudent to wait for some follow-through buying beyond the 61.8% Fibo. level before traders start positioning for any further near-term appreciating move.
On the flip side, the 50% Fibo. level, around the 0.9030 region, now seems to protect the immediate downside. This is followed by supports near the key 0.9000 round-figure mark and 100-day SMA support, currently around the 0.8985-80 region.
The latter nears 38.2% Fibo. level and a subsequent slide will negate the constructive outlook. This, in turn, will set the stage for a slide towards the 0.8915 horizontal support en-route 23.6% Fibo. level, around the 0.8885-80 region.
USD/CHF daily chart
Technical levels to watch
Information on these pages contains forward-looking statements that involve risks and uncertainties. Markets and instruments profiled on this page are for informational purposes only and should not in any way come across as a recommendation to buy or sell in these assets. You should do your own thorough research before making any investment decisions. FXStreet does not in any way guarantee that this information is free from mistakes, errors, or material misstatements. It also does not guarantee that this information is of a timely nature. Investing in Open Markets involves a great deal of risk, including the loss of all or a portion of your investment, as well as emotional distress. All risks, losses and costs associated with investing, including total loss of principal, are your responsibility. The views and opinions expressed in this article are those of the authors and do not necessarily reflect the official policy or position of FXStreet nor its advertisers. The author will not be held responsible for information that is found at the end of links posted on this page.
If not otherwise explicitly mentioned in the body of the article, at the time of writing, the author has no position in any stock mentioned in this article and no business relationship with any company mentioned. The author has not received compensation for writing this article, other than from FXStreet.
FXStreet and the author do not provide personalized recommendations. The author makes no representations as to the accuracy, completeness, or suitability of this information. FXStreet and the author will not be liable for any errors, omissions or any losses, injuries or damages arising from this information and its display or use. Errors and omissions excepted.
The author and FXStreet are not registered investment advisors and nothing in this article is intended to be investment advice.
Recommended content
Editors’ Picks
USD/JPY jumps above 156.00 on BoJ's steady policy

USD/JPY has come under intense buying pressure, surging past 156.00 after the Bank of Japan kept the key rate unchanged but tweaked its policy statement. The BoJ maintained its fiscal year 2024 and 2025 core inflation forecasts, disappointing the Japanese Yen buyers.
AUD/USD consolidates gains above 0.6500 after Australian PPI data

AUD/USD is consolidating gains above 0.6500 in Asian trading on Friday. The pair capitalizes on an annual increase in Australian PPI data. Meanwhile, a softer US Dollar and improving market mood also underpin the Aussie ahead of the US PCE inflation data.
Gold price flatlines as traders look to US PCE Price Index for some meaningful impetus

Gold price lacks any firm intraday direction and is influenced by a combination of diverging forces. The weaker US GDP print and a rise in US inflation benefit the metal amid subdued USD demand. Hawkish Fed expectations cap the upside as traders await the release of the US PCE Price Index.
Stripe looks to bring back crypto payments as stablecoin market cap hits all-time high

Stripe announced on Thursday that it would add support for USDC stablecoin, as the stablecoin market exploded in March, according to reports by Cryptocompare.
US economy: Slower growth with stronger inflation

The US Dollar strengthened, and stocks fell after statistical data from the US. The focus was on the preliminary estimate of GDP for the first quarter. Annualised quarterly growth came in at just 1.6%, down from the 2.5% and 3.4% previously forecast.