
AUD/USD Rate Rally Pushes RSI Into Overbought Territory
AUD/USD appears to be on track to test the February 2018 high (0.8067) as it extends the series of higher highs and lows carried over from the previous week, with the break above last month’s high (0.7820) negating the scope for a double-top formation as key market themes remain in place.
At the same time, developments in the RSI suggest that the recent pullback in AUD/USD was an exhaustion in the broader trend rather than a change in market behavior as the oscillator breaks out of the bearish formations from earlier this year, and the extreme reading in the indicator is likely to be accompanied by a further appreciation in the exchange rate like the behavior seen in 2020.
As a result, the Australian Dollar may continue to outperform its US counterpart even though the Reserve Bank of Australia (RBA) plans to “purchase an additional $100 billion of bonds issued by the Australian Government and states and territories when the current bond purchase program is completed in mid-April” as the Federal Reserve’s balance sheet climbs to a fresh record high of $7.442 trillion in February.
In turn, the AUD/USD rally may gather pace ahead of the next Reserve Bank of Australia (RBA) interest rate decision on March 2 as long as the RSI holds above 70, and key market themes may continue to influence the exchange rate as the crowding behavior from 2020 resurfaces.
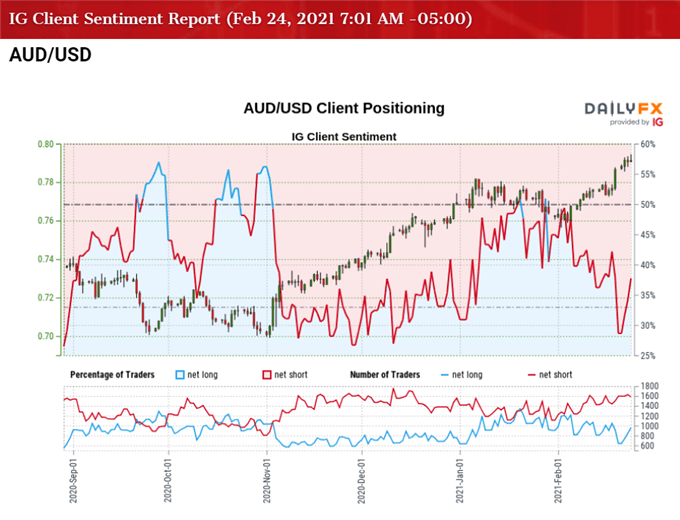
The IG Client Sentiment report shows 40.70% of traders are currently net-long AUD/USD as the ratio of traders short to long stands at 1.46 to 1.
The number of traders net-long is 18.10% higher than yesterday and 1.38% higher from last week, while the number of traders net-short is 9.84% lower than yesterday and 1.42% higher from last week. The rise in net-long position comes as AUD/USD breaks above the January high (0.7820), while the decline in net-short interest has helped to alleviate the tilt in retail sentiment as only 39.44% of traders were net-long the pair during the previous week.
With that said, the recent pullback in AUD/USD appears to have been an exhaustion in the broader trend rather than a change in market behavior as it trades to a fresh yearly high (0.7946), and developments in the Relative Strength Index (RSI) indicate a further appreciation in the exchange rate as the oscillator pushes into overbought territory.
AUD/USD RATE DAILY CHART
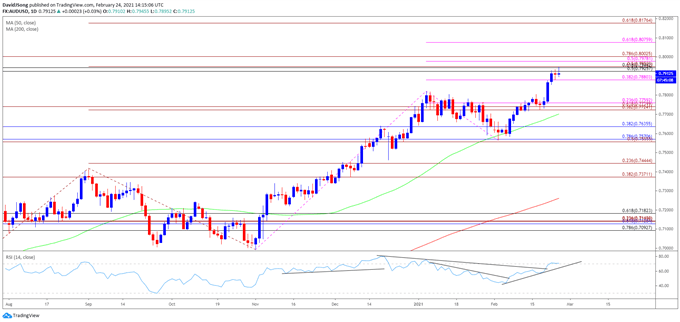
Source: Trading View
- Keep in mind, the AUD/USD correction from the September high (0.7414) proved to be an exhaustion in the bullish trend rather than a change in behavior as the exchange rate traded to fresh yearly highs throughout December.
- At the same time, developments in the Relative Strength Index (RSI)showed the bullish momentum gathering pace as the indicator pushed into overbought territory for the first time since September, with the break above 70 accompanied by a further appreciation in AUD/USD like the behavior seen in the first half of 2020.
- However, a textbook RSI sell signal emerged following the failed attempt to test the March 2018 high (0.7916), with AUD/USD trading to fresh 2021 lows in February as it failed to preserve the January range.
- Nevertheless, the pullback from the January high (0.7820) appears to be an exhaustion in the broader trend rather than a shift in market behavior amid the string of failed attempts to break/close below the 0.7560 (50% expansion) to 0.7580 (61.8% expansion) region, with the RSI highlighting a similar dynamic as the indicator breaks out of the bearish formations from earlier this year and pushes into overbought territory.
- The extreme reading in the RSI is likely to be accompanied by a further appreciation in AUD/USD like the behavior seen in 2020, but need a break/close above the Fibonacci overlap around 0.7930 (50% retracement) to 0.7950 (50% expansion) to bring the 0.7980 (50% expansion) to 0.8000 (78.6% expansion) zone on the radar.
- The February 2018 high (0.8067) comes up next, which largely coincides with the 0.8080 (61.8% expansion) region, with the next area of interest coming in around 0.8180 (61.8% expansion).
Disclosure: See the full disclosure for DailyFX here.


