Join Our Telegram channel to stay up to date on breaking news coverage
ETH Price Prediction – February 24
ETH/USD price action continues to move within a bullish nature, forming technical patterns for moves to the north.
ETH/USD Market
Key Levels:
Resistance levels: $2000, $2100, $2200
Support levels: $1250, $1150, $1050
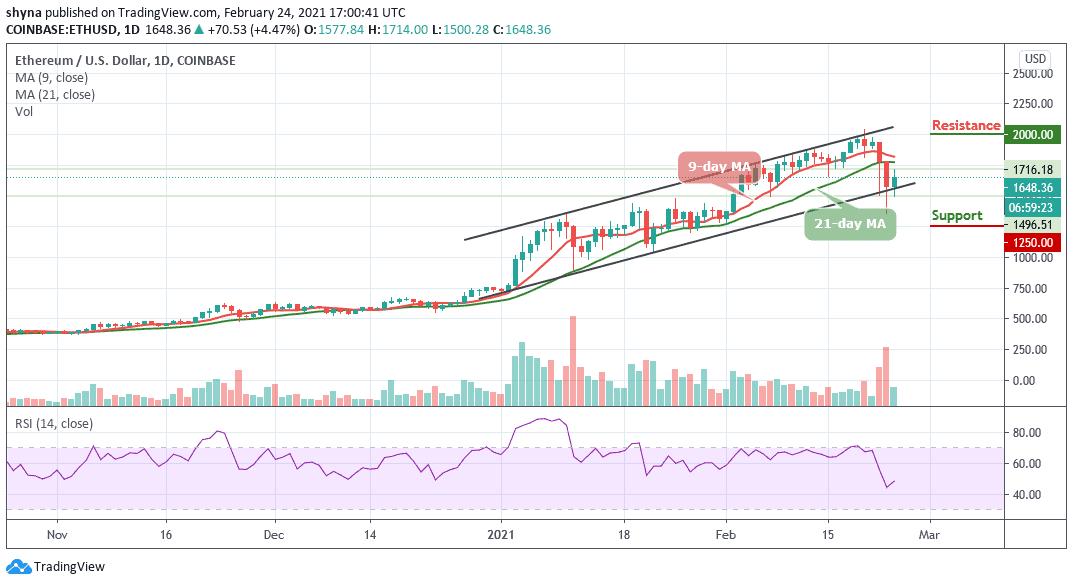
ETH/USD continues to struggle this week as it trades with a slight gain of 4.47% to bring back the price of the coin from the low of $1500. Ethereum (ETH) continues to trade within a long-term ascending price channel. A few days ago, the cryptocurrency couldn’t break above the resistance at $2100 but it must overcome here to travel higher.
Where is ETH Price Going Next?
Looking ahead, if the sellers push ETH back below the lower boundary of the channel, initial support lies at $1400. Beneath this, support is located at $1300, and further supports are located at $1250, $1150, and $1050. Alternatively, if the buyers regroup and start to push higher above the 9–day and 21-day moving averages, the key resistance is located at $1800. Above this, higher resistance lies at $2000, $2100, and $2200.
However, the technical indicator RSI (14) is moving above the 45-level, if the market price continues to move higher, it could rise above the daily high of $1714 resistance level.
When compares with BTC, Ethereum is currently trading at 0.33 BTC after witnessing a bearish moment in the last few days. Looking at the daily chart, the current trend of the coin is looking bearish in the short-term, but should the price break below the lower boundary of the channel, the new monthly low might be created.
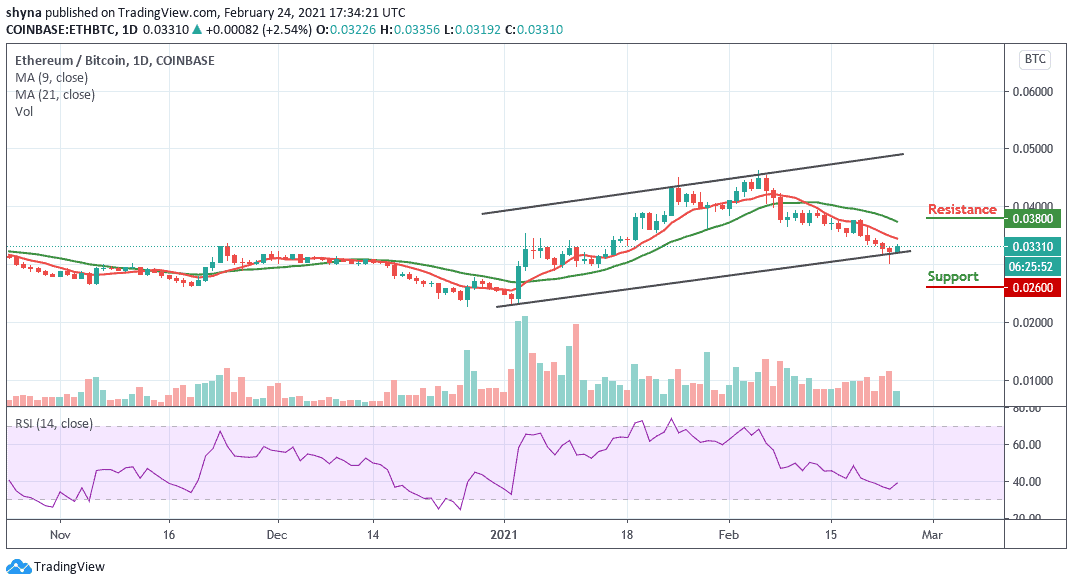
However, a continuation of the downtrend could hit the main support at 0.0315 BTC before falling to 0.0300 BTC and below. More so, the buyers could probably push the market above the upper boundary of the channel, with potential resistance of 0.038 BTC and above. The technical indicator RSI (14) moves below the 40-level, indicating that the bearish movement may continue.
Join Our Telegram channel to stay up to date on breaking news coverage