- USD/JPY continued gaining traction for the third straight session on Thursday.
- The formation of an ascending channel supports prospects for additional gains.
- Bulls seem poised to challenge channel resistance near the 106.70-75 region.
The USD/JPY pair built on this week's goodish rebound from sub-105.00 levels and gained traction for the third consecutive session on Thursday. The pair jumped back above the 106.00 round-figure mark and was last seen trading well within the striking distance of monthly tops.
The US Treasury bond yields continued scaling higher following the release of mostly upbeat US macro releases and remained supportive of the strong bid tone surrounding the USD/JPY pair. However, a broad-based US dollar weakness held bulls from placing fresh bets and capped gains.
From a technical perspective, the pair has been trending higher along an upward sloping channel over the past two months or so. The formation points to a well-established short-term bullish trend and supports prospects for a further appreciating move amid fading safe-haven demand.
The constructive outlook is further reinforced by bullish technical indicators on the daily chart. A subsequent strength beyond the 106.20-25 region (monthly tops touched on February 17) will reaffirm the bullish and set the stage for additional near-term gains.
The USD/JPY pair might then aim to challenge the trend-channel hurdle, currently near the 106.70-75 region. Some follow-through buying will be seen as a fresh trigger for bullish traders and push the pair beyond the 107.00 mark, towards the next resistance near mid-107.00s.
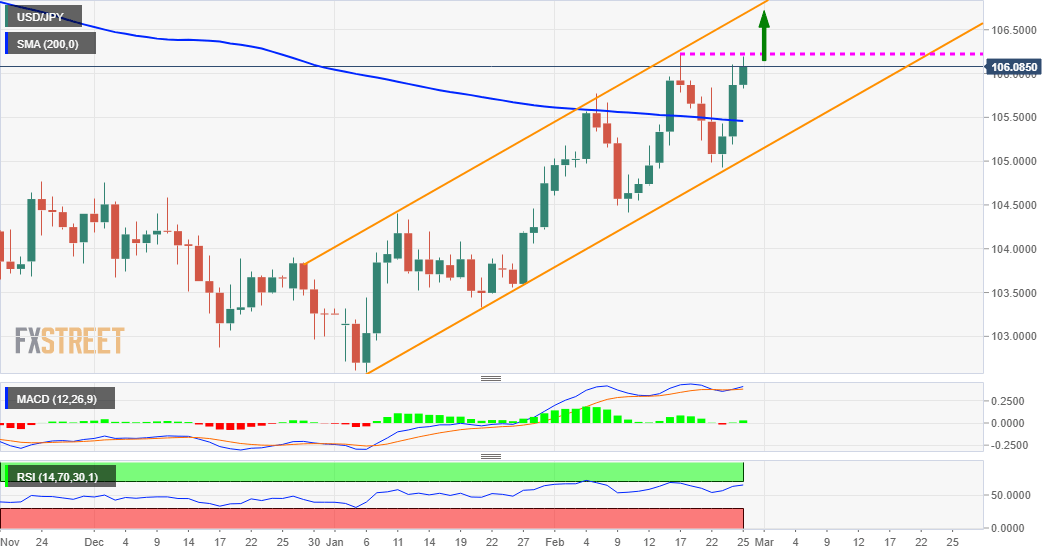
On the flip side, the 106.00 round-figure mark now seems to protect the immediate downside. This is followed by the very important 200-day SMA, currently around the 105.40 region ahead of the trend-channel support near the key 105.00 psychological mark.
Failure to defend the mentioned support levels will negate the near-term bullish bias and prompt some aggressive technical selling. The subsequent fall has the potential to drag the USD/JPY pair further below monthly swing lows support, around the 104.40 region.
USD/JPY daily chart
Technical levels to watch
Information on these pages contains forward-looking statements that involve risks and uncertainties. Markets and instruments profiled on this page are for informational purposes only and should not in any way come across as a recommendation to buy or sell in these assets. You should do your own thorough research before making any investment decisions. FXStreet does not in any way guarantee that this information is free from mistakes, errors, or material misstatements. It also does not guarantee that this information is of a timely nature. Investing in Open Markets involves a great deal of risk, including the loss of all or a portion of your investment, as well as emotional distress. All risks, losses and costs associated with investing, including total loss of principal, are your responsibility. The views and opinions expressed in this article are those of the authors and do not necessarily reflect the official policy or position of FXStreet nor its advertisers. The author will not be held responsible for information that is found at the end of links posted on this page.
If not otherwise explicitly mentioned in the body of the article, at the time of writing, the author has no position in any stock mentioned in this article and no business relationship with any company mentioned. The author has not received compensation for writing this article, other than from FXStreet.
FXStreet and the author do not provide personalized recommendations. The author makes no representations as to the accuracy, completeness, or suitability of this information. FXStreet and the author will not be liable for any errors, omissions or any losses, injuries or damages arising from this information and its display or use. Errors and omissions excepted.
The author and FXStreet are not registered investment advisors and nothing in this article is intended to be investment advice.
Recommended content
Editors’ Picks
EUR/USD edges lower toward 1.0700 post-US PCE

EUR/USD stays under modest bearish pressure but manages to hold above 1.0700 in the American session on Friday. The US Dollar (USD) gathers strength against its rivals after the stronger-than-forecast PCE inflation data, not allowing the pair to gain traction.
GBP/USD retreats to 1.2500 on renewed USD strength

GBP/USD lost its traction and turned negative on the day near 1.2500. Following the stronger-than-expected PCE inflation readings from the US, the USD stays resilient and makes it difficult for the pair to gather recovery momentum.
Gold struggles to hold above $2,350 following US inflation

Gold turned south and declined toward $2,340, erasing a large portion of its daily gains, as the USD benefited from PCE inflation data. The benchmark 10-year US yield, however, stays in negative territory and helps XAU/USD limit its losses.
Bitcoin Weekly Forecast: BTC’s next breakout could propel it to $80,000 Premium

Bitcoin’s recent price consolidation could be nearing its end as technical indicators and on-chain metrics suggest a potential upward breakout. However, this move would not be straightforward and could punish impatient investors.
Week ahead – Hawkish risk as Fed and NFP on tap, Eurozone data eyed too

Fed meets on Wednesday as US inflation stays elevated. Will Friday’s jobs report bring relief or more angst for the markets? Eurozone flash GDP and CPI numbers in focus for the Euro.