Join Our Telegram channel to stay up to date on breaking news coverage
ETH Price Prediction – February 25
The price of Ethereum is seen moving below the key supports. The price may continue to move down towards $1500 if it fails to stay above $1550.
ETH/USD Market
Key Levels:
Resistance levels: $1900, $2000, $2100
Support levels: $1300, $1200, $1100

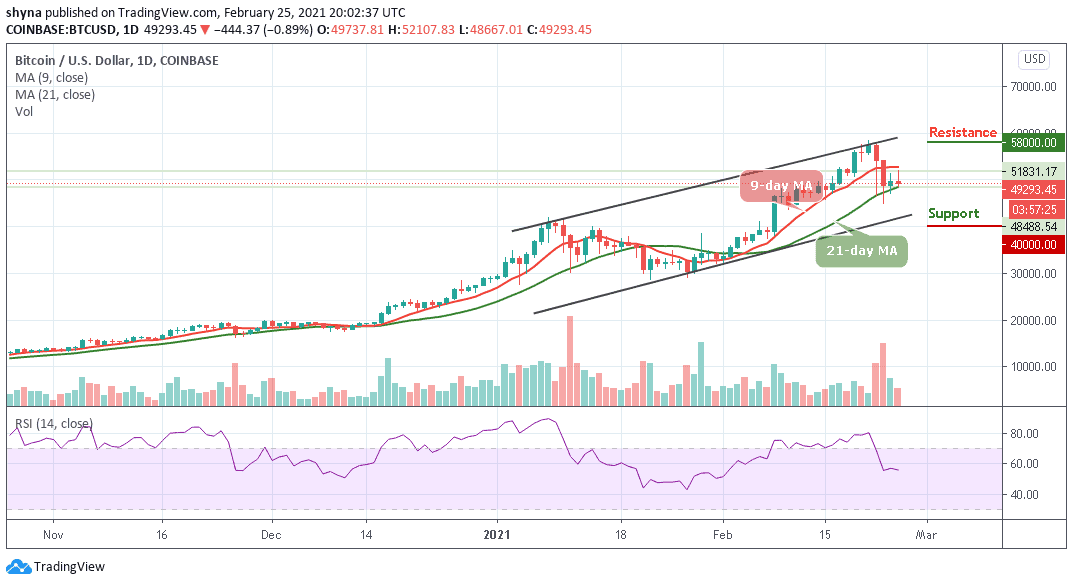
As the market opens today, after touching the high of $1672 level, ETH/USD has been dropping with a bearish bias. The coin opened at $1625.27 and currently dropped below the $1600 level. Ethereum price did start a nasty decline a couple of days ago and broke many supports near $1300. The price could correct higher, but it is likely to face sellers below the lower boundary of the channel.
What is the Next Direction for Ethereum?
On the downside, there is a close below the $1600 level as the coin moves below the 9-day and 21-day moving averages. As a matter of fact, dropping further could open the doors for more losses and the price may tumble below the $1400 level. More so, should it spike below the $1350 support, the critical support levels of $1300, $1200, and $1100 may come into focus as the technical indicator RSI (14) nosedives below the 45-level.
Moreover, ETH/USD could either recover above $1600 or extend its decline. On the upside, the next major resistance is near the $1700 level. However, the price must climb above the $1900, $2100, and $2100 resistance levels to move back into a positive zone. If not, there is a risk of more downsides below the channel.
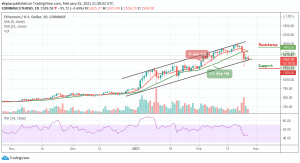
When compares with Bitcoin, the Ethereum pair is experiencing some difficulties, especially in the past few days. The Ethereum (ETH) recently breaks under the 9-day and 21-day moving averages and may continue to fall towards the subsequent support of 3000 SAT. The critical support level could be found at $3900 and $3800 respectively.
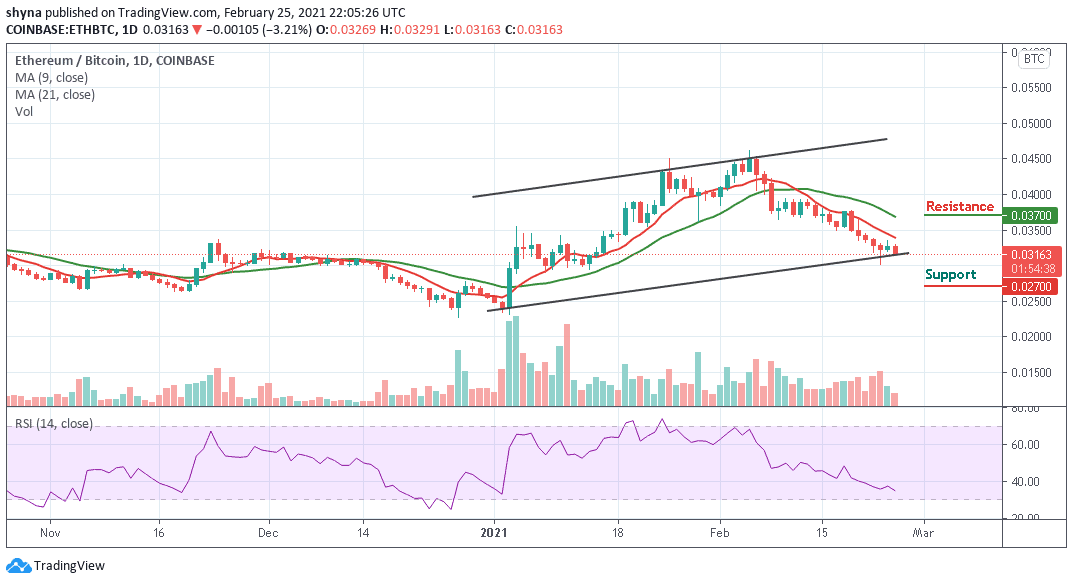
However, the technical indicator RSI (14) remains at the downside as the signal line moves toward the oversold region. More so, if it drops beneath this barrier, then the market would have to be considered as bearish and the support levels to watch are 2700 SAT and below. Meanwhile, to resume higher, the price of Ethereum must rise much higher and break above the 3700 SAT level and above.
Join Our Telegram channel to stay up to date on breaking news coverage