- USD/CHF trims early Asian losses to revisit 0.9060-65 region.
- Upbeat MACD, bullish chart patterns favor the buyers.
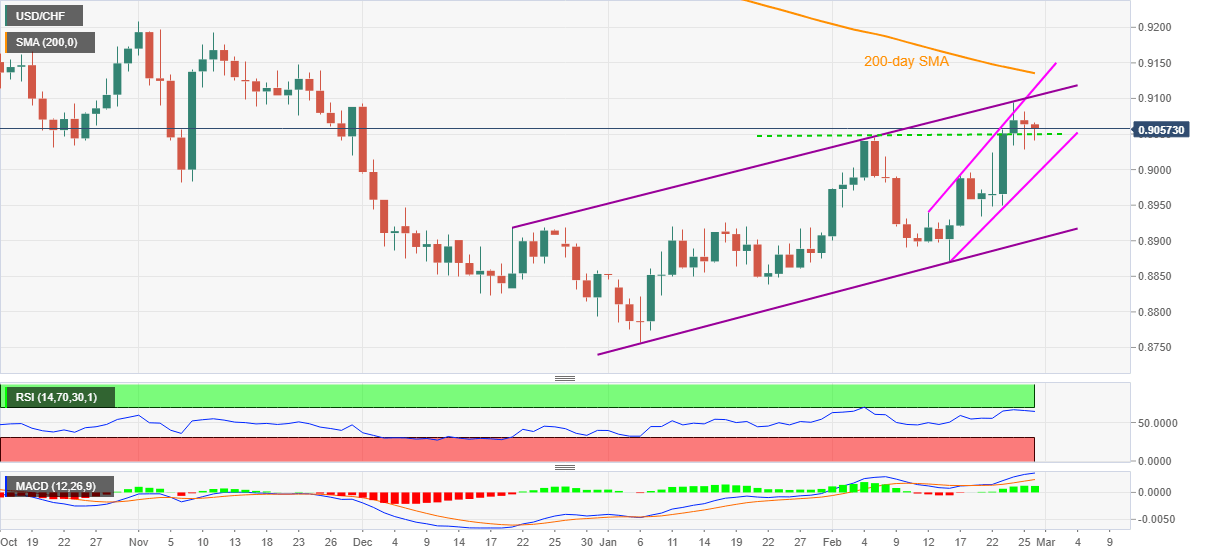
- Upper line of the 10-week-old rising channel tests short-term bulls before immediate ascending channel and 200-day SMA.
- Bears need to defy multiple channels, refresh monthly low to retake controls.
USD/CHF picks up bids around 0.9060 while heading into Friday’s European session. In doing so, the Swiss currency pair attacks the familiar region surrounding the intraday high amid bullish MACD.
A sustained upside clearance of the early-month top joins bullish MACD and two ascending trend channels to back the USD/CHF buyers.
However, the road to the north has many speed-breakers wherein the resistance line of the longer channel, at 0.9100 now, restricts the quote’s nearby rise.
Even if the USD/CHF bulls manage to cross 0.9100, life won’t be easy as the upper limit of the two-week-old ascending channel and 200-day SMA, respectively around 0.9115 and 0.9135 respectively, will challenge the further upside.
Alternatively, short-term sellers will seek a clear break of 0.9040, comprising the early month top, to challenge immediate channel’s support, currently around 0.8990. However, the USD/CHF bears won’t be serious until the quote drops below the multi-week-old rising channel’s lower line, at 0.8900 now. Also acting as a downside filter is the monthly low near 0.8870.
Overall, USD/CHF remains on the firm footing but the upside moves are likely to be capped.
USD/CHF daily chart
Trend: Gradual upside expected
Information on these pages contains forward-looking statements that involve risks and uncertainties. Markets and instruments profiled on this page are for informational purposes only and should not in any way come across as a recommendation to buy or sell in these assets. You should do your own thorough research before making any investment decisions. FXStreet does not in any way guarantee that this information is free from mistakes, errors, or material misstatements. It also does not guarantee that this information is of a timely nature. Investing in Open Markets involves a great deal of risk, including the loss of all or a portion of your investment, as well as emotional distress. All risks, losses and costs associated with investing, including total loss of principal, are your responsibility. The views and opinions expressed in this article are those of the authors and do not necessarily reflect the official policy or position of FXStreet nor its advertisers. The author will not be held responsible for information that is found at the end of links posted on this page.
If not otherwise explicitly mentioned in the body of the article, at the time of writing, the author has no position in any stock mentioned in this article and no business relationship with any company mentioned. The author has not received compensation for writing this article, other than from FXStreet.
FXStreet and the author do not provide personalized recommendations. The author makes no representations as to the accuracy, completeness, or suitability of this information. FXStreet and the author will not be liable for any errors, omissions or any losses, injuries or damages arising from this information and its display or use. Errors and omissions excepted.
The author and FXStreet are not registered investment advisors and nothing in this article is intended to be investment advice.
Recommended content
Editors’ Picks
AUD/USD hovers around 0.6500 amid light trading, ahead of US GDP

AUD/USD is trading close to 0.6500 in Asian trading on Thursday, lacking a clear directional impetus amid an Anzac Day holiday in Australia. Meanwhile, traders stay cautious due ti risk-aversion and ahead of the key US Q1 GDP release.
USD/JPY finds its highest bids since 1990, near 155.50

USD/JPY keeps breaking into its highest chart territory since June of 1990 early Thursday, testing 155.50 for the first time in 34 years as the Japanese Yen remains vulnerable, despite looming Japanese intervention risks. Focus shifts to Thursday's US GDP report and the BoJ decision on Friday.
Gold price treads water near $2,320, awaits US GDP data

Gold price recovers losses but keeps its range near $2,320 early Thursday. Renewed weakness in the US Dollar and the US Treasury yields allow Gold buyers to breathe a sigh of relief. Gold price stays vulnerable amid Middle East de-escalation, awaiting US Q1 GDP data.
Injective price weakness persists despite over 5.9 million INJ tokens burned
Injective price is trading with a bearish bias, stuck in the lower section of the market range. The bearish outlook abounds despite the network's deflationary efforts to pump the price. Coupled with broader market gloom, INJ token’s doomed days may not be over yet.
Meta Platforms Earnings: META sinks 10% on lower Q2 revenue guidance Premium

This must be "opposites" week. While Doppelganger Tesla rode horrible misses on Tuesday to a double-digit rally, Meta Platforms produced impressive beats above Wall Street consensus after the close on Wednesday, only to watch the share price collapse by nearly 10%.