- USD/JPY attracted some dip-buying on Friday and turned positive for the straight session.
- The set-up supports prospects for a move towards the channel hurdle near the 105.75 area.
- Any weakness below the 106.00 mark might still be seen as an opportunity for bullish traders.
The USD/JPY pair reversed an early dip to the 105.85 region and turned positive for the fourth consecutive session on Friday. The momentum pushed the pair to fresh five-month tops, around mid-106.00s during the first half of the European session.
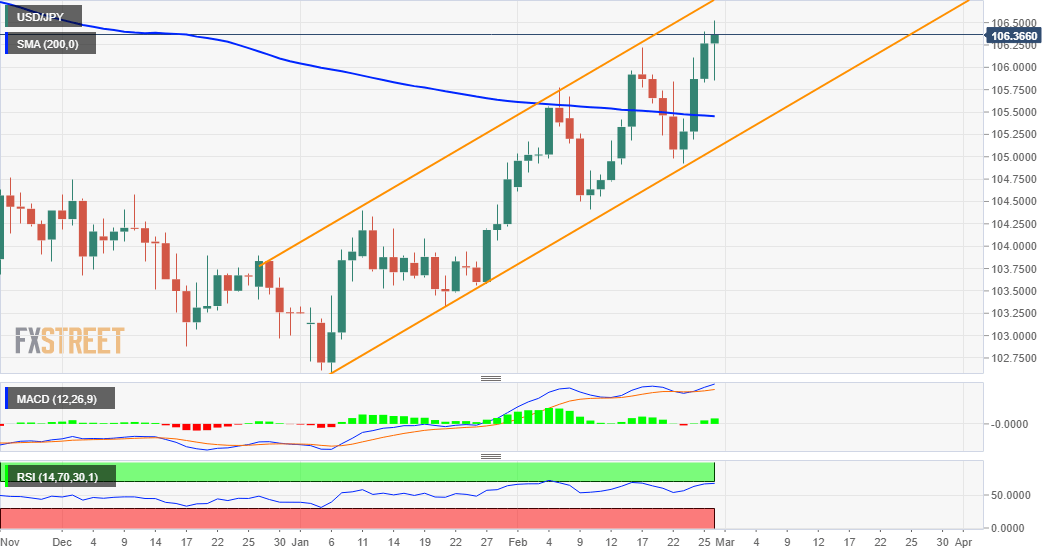
Looking at the technical picture, the recent move up from YTD lows has been along an upward sloping channel. The ascending trend-channel formation points to a well-established short-term bullish trend and supports prospects for additional gains.
The constructive outlook is reinforced by oscillators on the daily chart, which are holding in the bullish territory and still far from being in the overbought zone. Hence, a subsequent strength towards the trend-channel resistance, near the 106.75 region, looks a distinct possibility.
A sustained move beyond mark a fresh bullish breakout and set the stage for a further near-term appreciating move. The USD/JPY pair might then accelerate the momentum towards the 107.00 mark en-route the next hurdle near the 107.55-60 supply zone.
On the flip side, the 106.00 mark now seems to protect the immediate downside. Any subsequent slide might continue to attract some dip-buying near the 105.85-80 region. This should help limit the fall near the very important 200-day SMA, around the 105.40 area.
The latter is closely followed by the trend-channel support, around the 105.15 region. Failure to defend the mentioned support, leading to a subsequent breakthrough the key 105.00 psychological mark will negate the near-term bullish outlook.
USD/JPY daily chart
Technical levels to watch
Information on these pages contains forward-looking statements that involve risks and uncertainties. Markets and instruments profiled on this page are for informational purposes only and should not in any way come across as a recommendation to buy or sell in these assets. You should do your own thorough research before making any investment decisions. FXStreet does not in any way guarantee that this information is free from mistakes, errors, or material misstatements. It also does not guarantee that this information is of a timely nature. Investing in Open Markets involves a great deal of risk, including the loss of all or a portion of your investment, as well as emotional distress. All risks, losses and costs associated with investing, including total loss of principal, are your responsibility. The views and opinions expressed in this article are those of the authors and do not necessarily reflect the official policy or position of FXStreet nor its advertisers. The author will not be held responsible for information that is found at the end of links posted on this page.
If not otherwise explicitly mentioned in the body of the article, at the time of writing, the author has no position in any stock mentioned in this article and no business relationship with any company mentioned. The author has not received compensation for writing this article, other than from FXStreet.
FXStreet and the author do not provide personalized recommendations. The author makes no representations as to the accuracy, completeness, or suitability of this information. FXStreet and the author will not be liable for any errors, omissions or any losses, injuries or damages arising from this information and its display or use. Errors and omissions excepted.
The author and FXStreet are not registered investment advisors and nothing in this article is intended to be investment advice.
Recommended content
Editors’ Picks
EUR/USD holds above 1.0700 ahead of key US data

EUR/USD trades in a tight range above 1.0700 in the early European session on Friday. The US Dollar struggles to gather strength ahead of key PCE Price Index data, the Fed's preferred gauge of inflation, and helps the pair hold its ground.
USD/JPY stays above 156.00 after BoJ Governor Ueda's comments

USD/JPY holds above 156.00 after surging above this level with the initial reaction to the Bank of Japan's decision to leave the policy settings unchanged. BoJ Governor said weak Yen was not impacting prices but added that they will watch FX developments closely.
Gold price oscillates in a range as the focus remains glued to the US PCE Price Index

Gold price struggles to attract any meaningful buyers amid the emergence of fresh USD buying. Bets that the Fed will keep rates higher for longer amid sticky inflation help revive the USD demand.
Sei Price Prediction: SEI is in the zone of interest after a 10% leap

Sei price has been in recovery mode for almost ten days now, following a fall of almost 65% beginning in mid-March. While the SEI bulls continue to show strength, the uptrend could prove premature as massive bearish sentiment hovers above the altcoin’s price.
US core PCE inflation set to signal firm price pressures as markets delay Federal Reserve rate cut bets

The core PCE Price Index, which excludes volatile food and energy prices, is seen as the more influential measure of inflation in terms of Fed positioning. The index is forecast to rise 0.3% on a monthly basis in March, matching February’s increase.