
Advertisement
Advertisement
The Big Picture – Where Could Gold Head From Here?
By:
Unquestionably fundamental events shape market sentiment, which dictates where the price of any given commodity or stock might go.
Since the beginning of time, rhythmic regularity has been the law of creation. Gradually man has acquired knowledge and power from studying the various manifestations of this law. The effects of the law are discernible in the behavior of tides, the heavenly bodies, cyclones, day and night, even life and death. This rhythmic regularity is called a cycle. — Ralph Nelson Elliott
Historically market analysts were divided into two camps. The first camp looks strictly at fundamental data and events to forecast future pricing. A second camp exists that utilizes technical indicators to determine future prices. There is a third camp, however, that some analysts, including myself, fit into, which can be loosely called a hybrid market technician. The hybrid market technician will utilize both fundamental data and technical indicators to create models that define where a market could go.
R. N. Elliott was a market technician who lived from 1871 to 1948 and was professionally trained as an accountant. He is, however, more well-known as the author of Elliott wave theory, who believed that there was a natural cycle or discernible pattern that could be found not only in nature but also in the price movement of stocks. Of all the market technicians, he is probably the most controversial, and as such, there are many technicians that look at his work in a negative light. However, there are also market technicians that have found his techniques, when properly implemented, to be extremely accurate in projecting future direction and cycles that exist in the financial markets.
In essence, Elliott wave theory believes that whether a market is in a bullish trend or a bearish trend, these trends exist with an identifiable structure that is labeled as a wave count. A wave count consists of a total of eight waves, with wave one through wave five constructing the impulse phase. What will follow will be a correction that can unfold in multiple ways but is typically looked at as an A, B, C wave count.
Chart 1
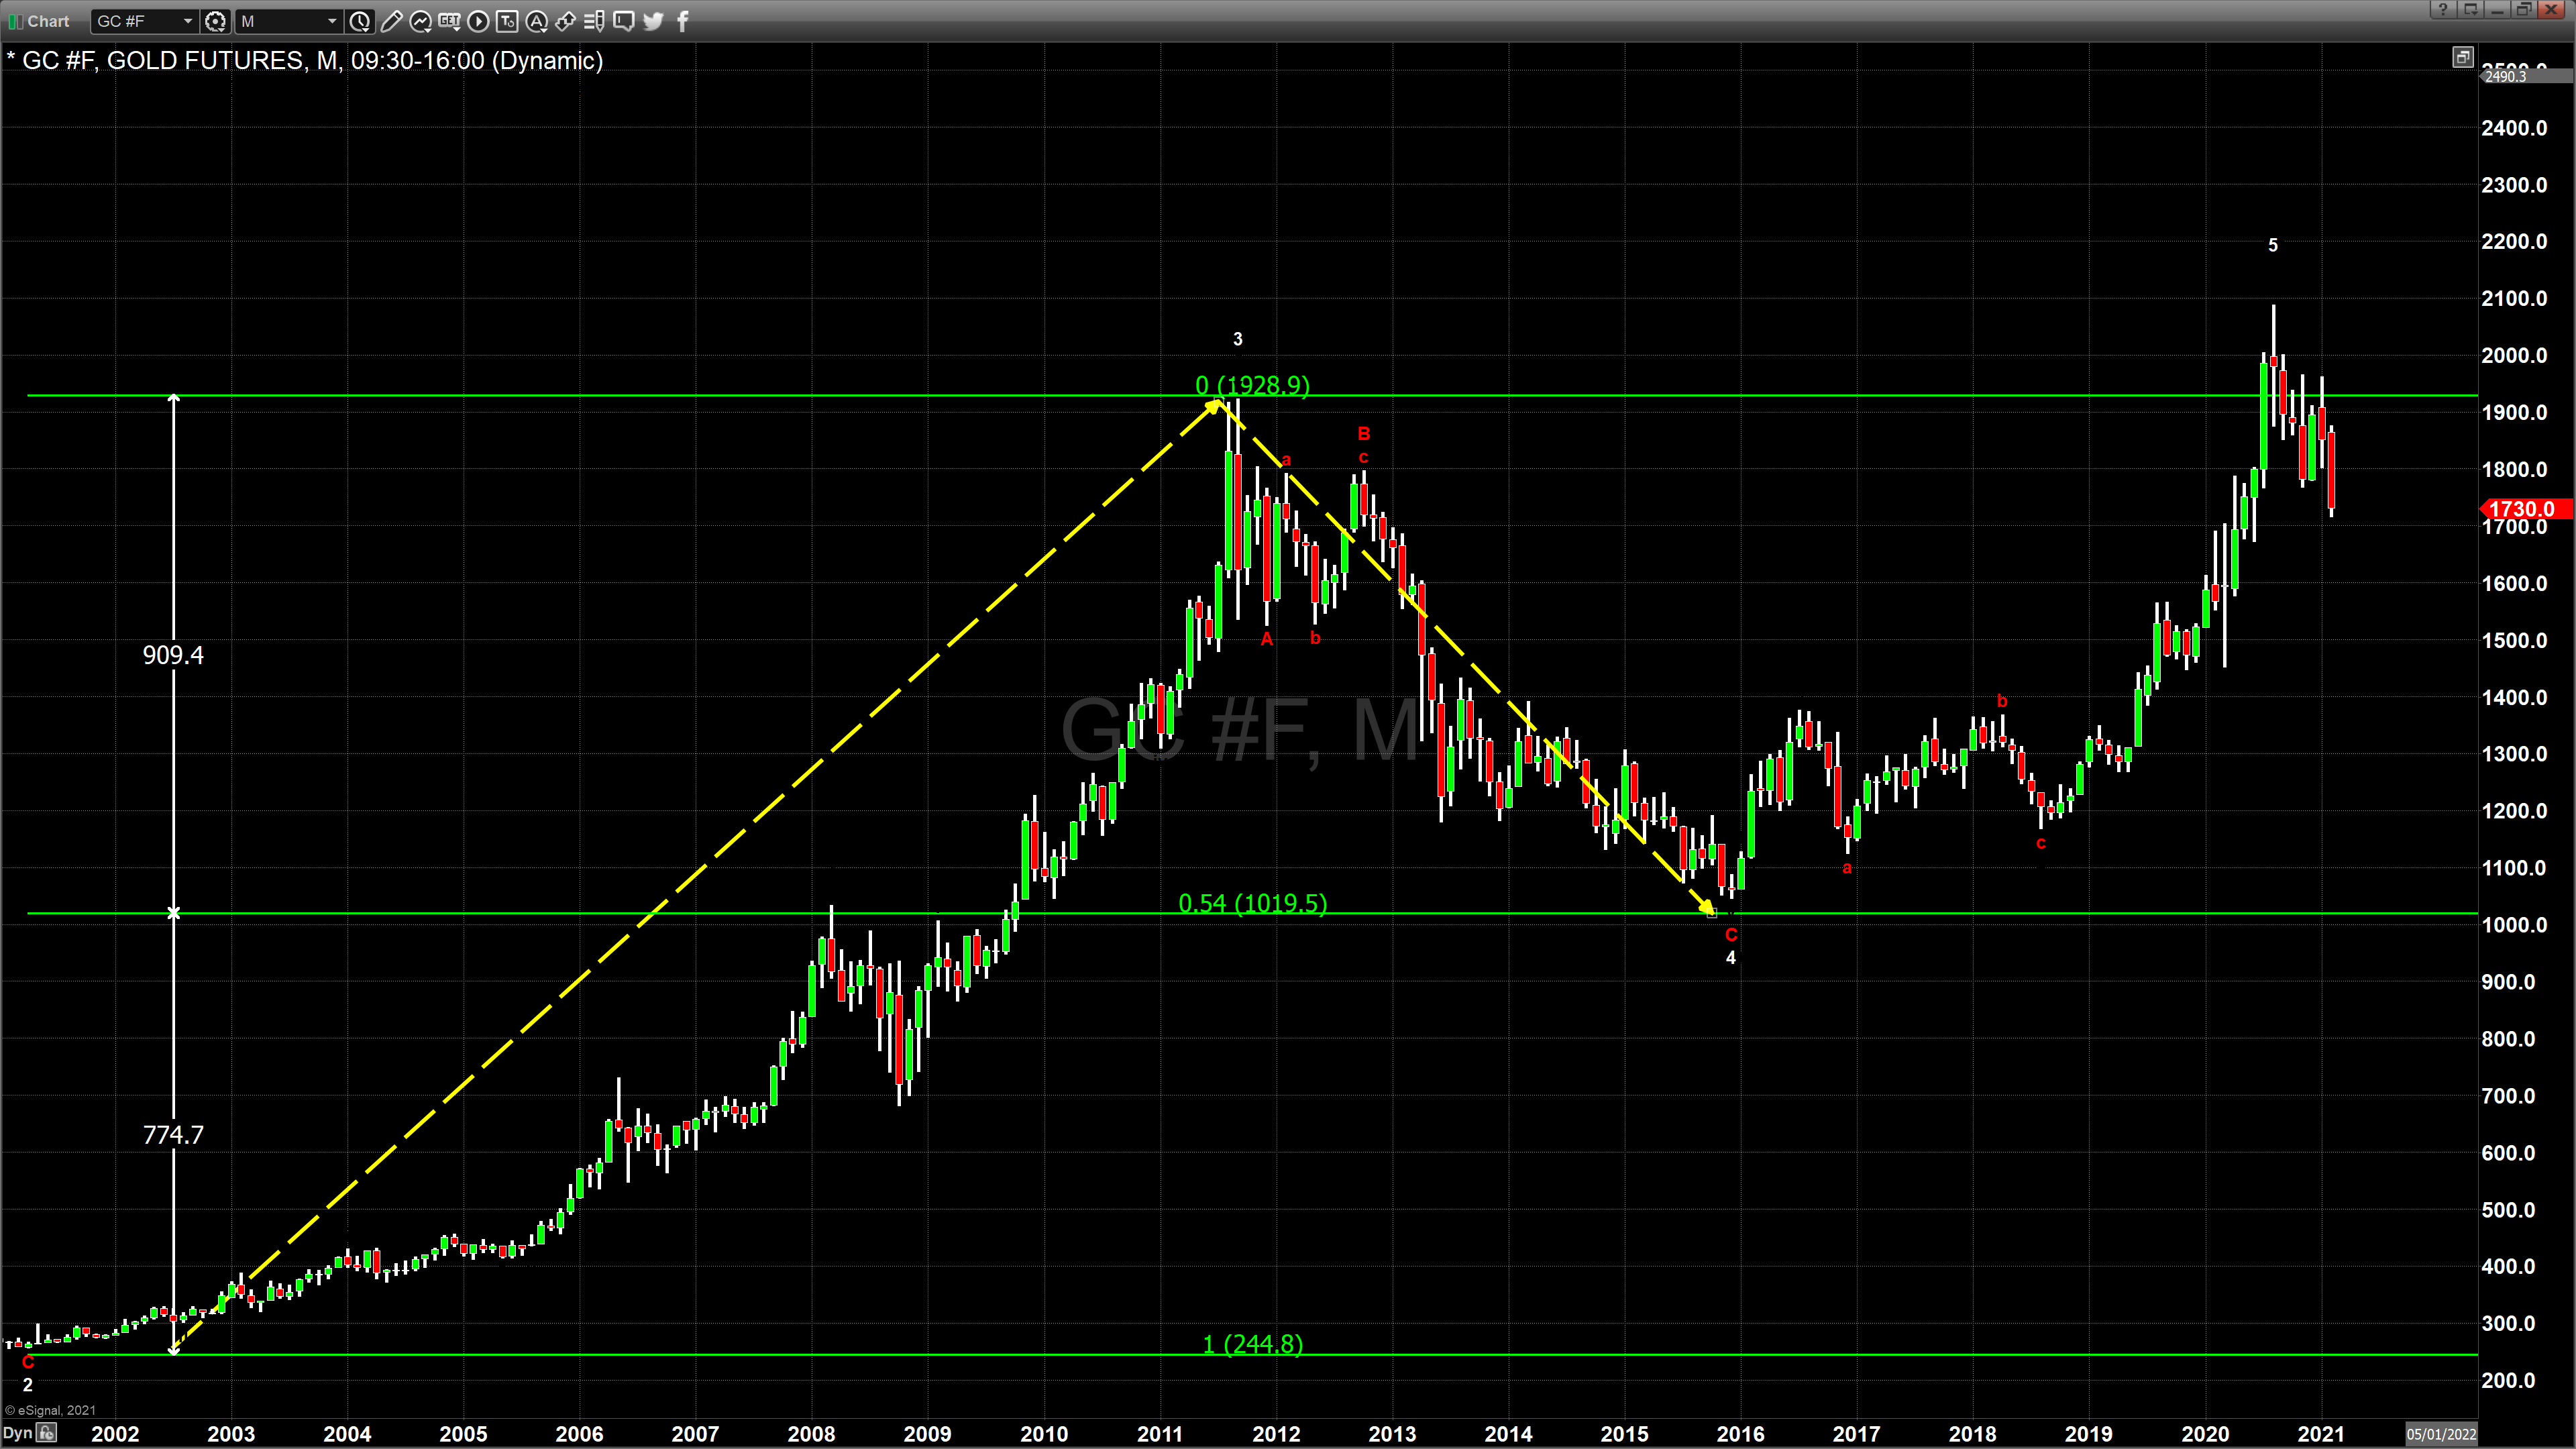
The following charts will look at the long-term cycle of gold as it traded from 2002 to 2021. Chart 1 looks at the longest wave, wave three as beginning in the middle of 2002 when gold was trading at approximately $250 per ounce up until its former record high at $1920, which occurred in the middle of 2011. It then looks at the correction from $1920-$1020 that occurred at the end of 2015 and labels that a corrective fourth wave.
Chart 2
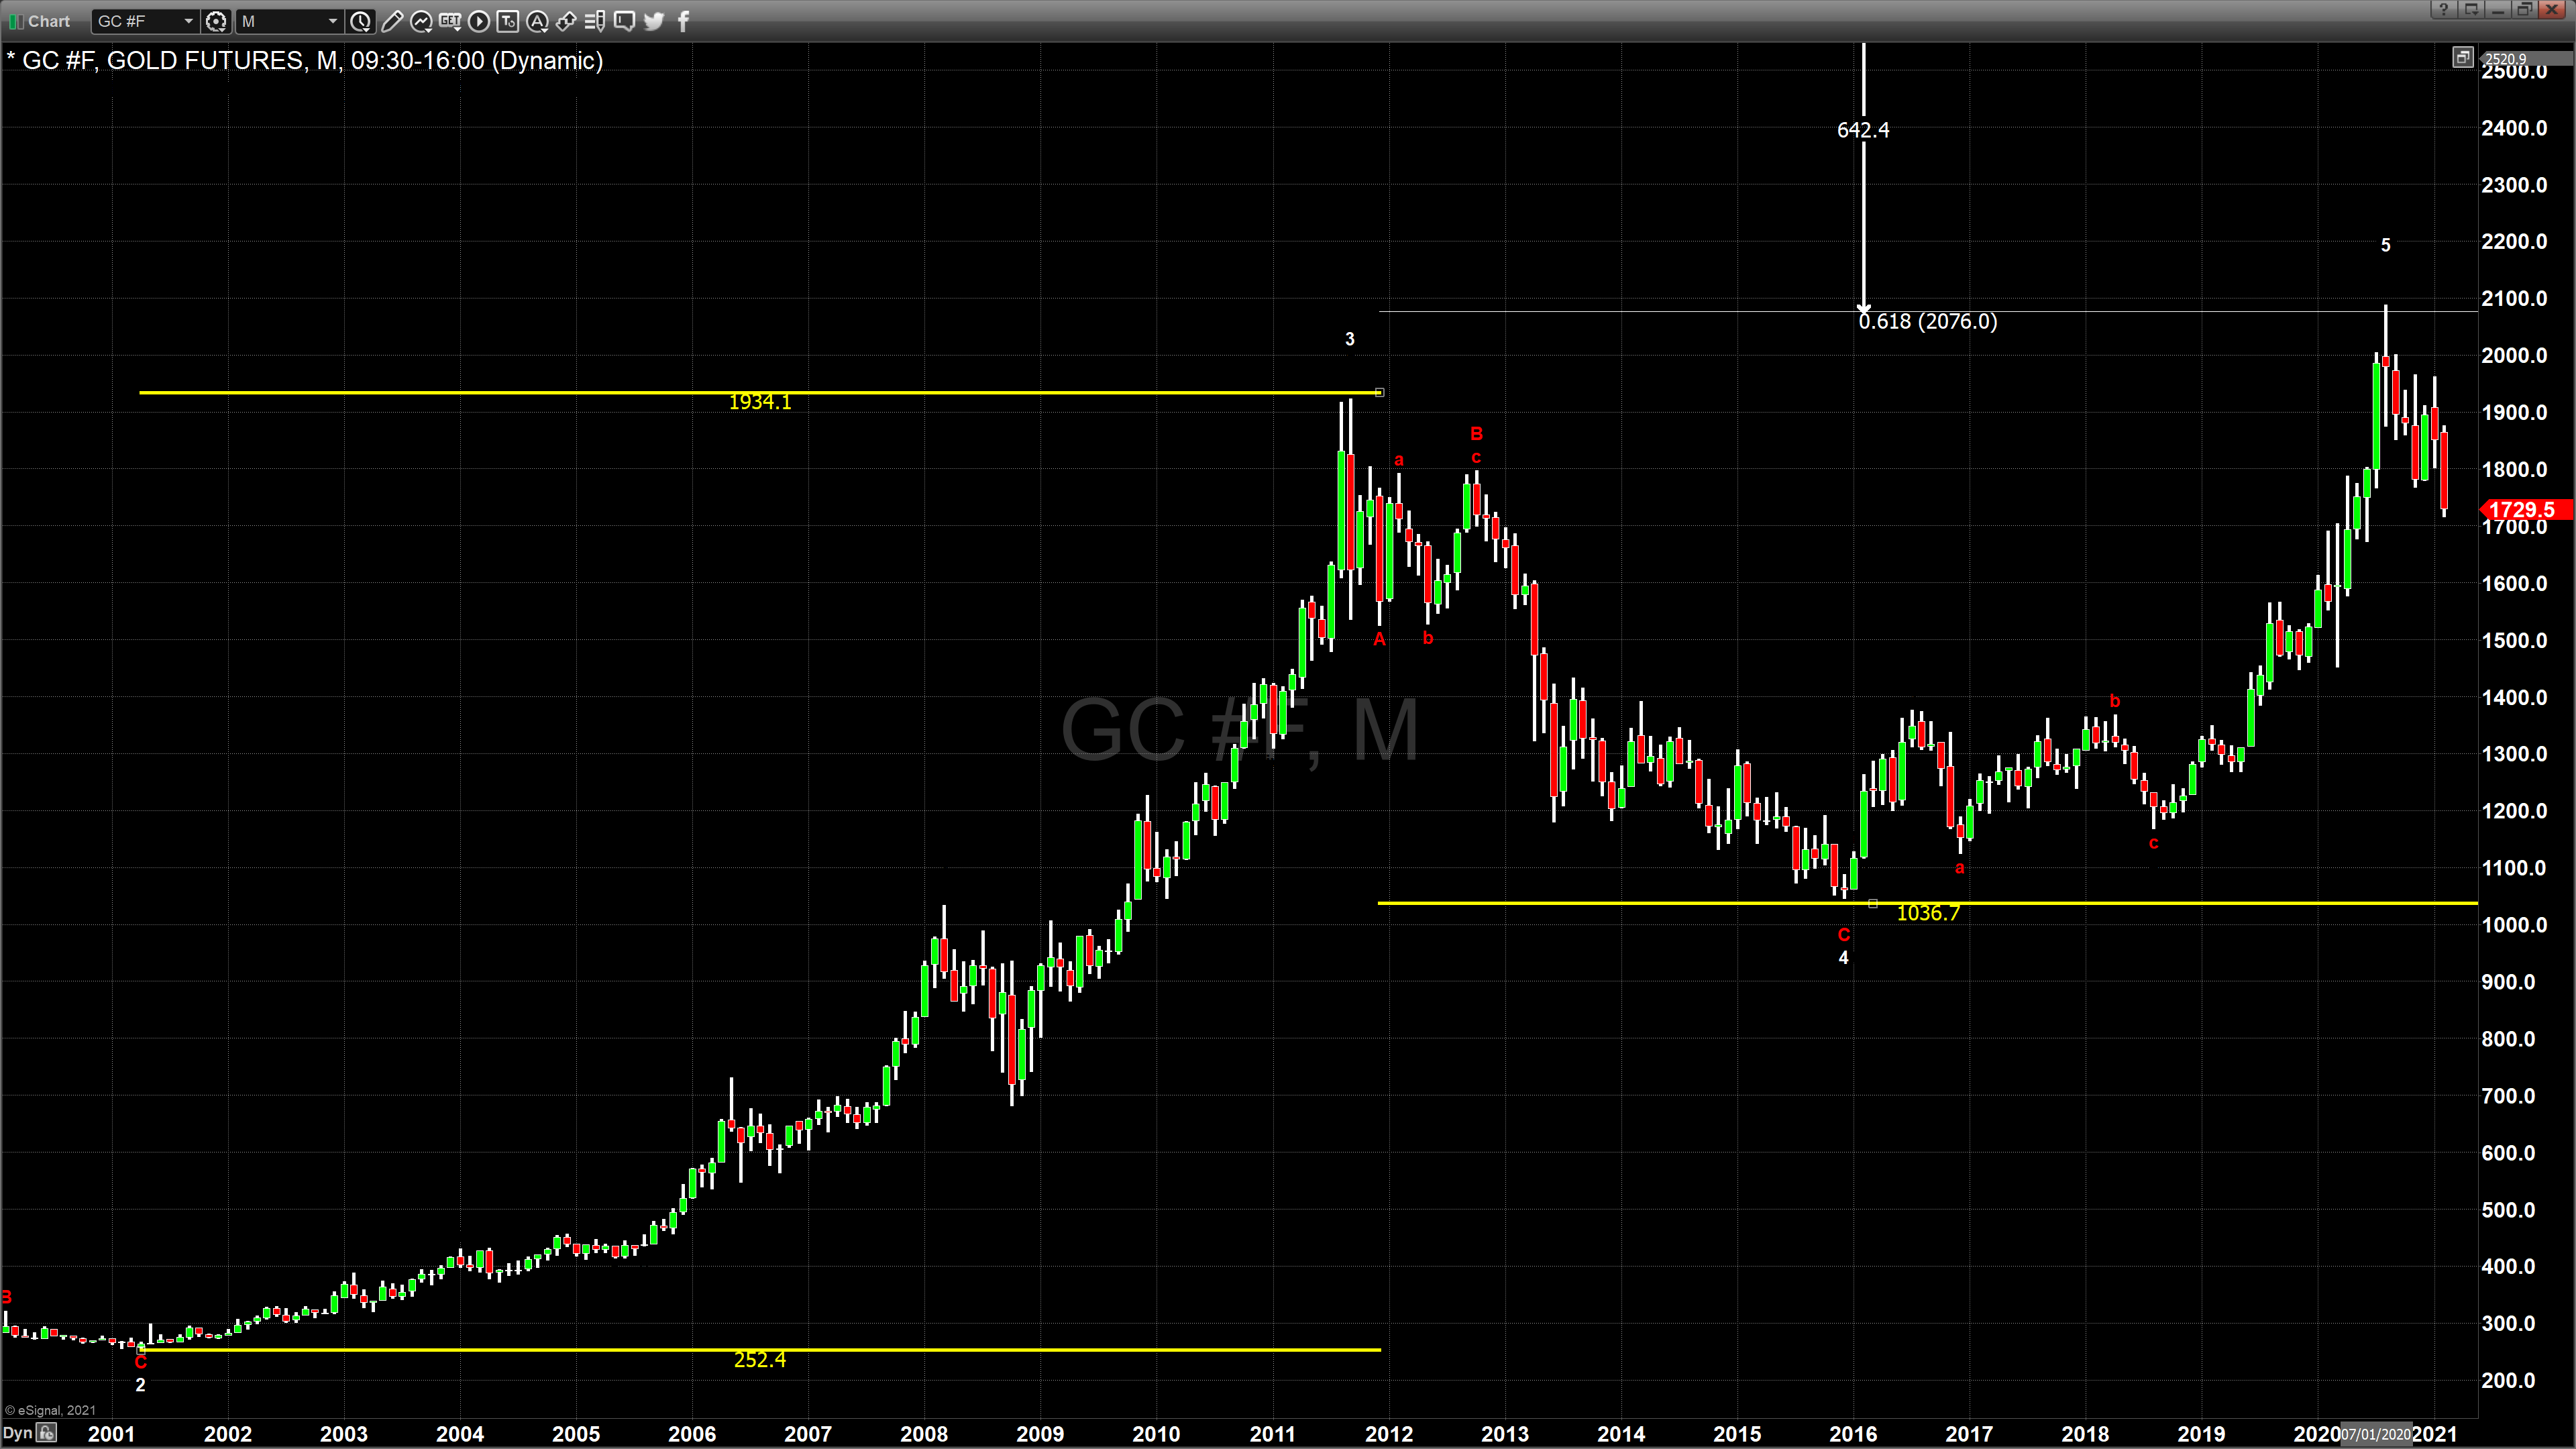
Chart 2 uses the data created from wave three and wave four to forecast where the fifth wave will conclude. The basic premise of this model is that the fifth wave will typically be a Fibonacci extension of .618 of wave three to calculate the price move in the fifth wave. It begins at the conclusion of the fourth wave and, as you can see from this chart, projected a top for gold prices in 2020 of $2076. This was not too far off of the actual number that came in, which was $2088. The most difficult waves to forecast are the benchmark waves. Both wave one and corrective wave A are the benchmark waves and much harder to predict.
Chart 3
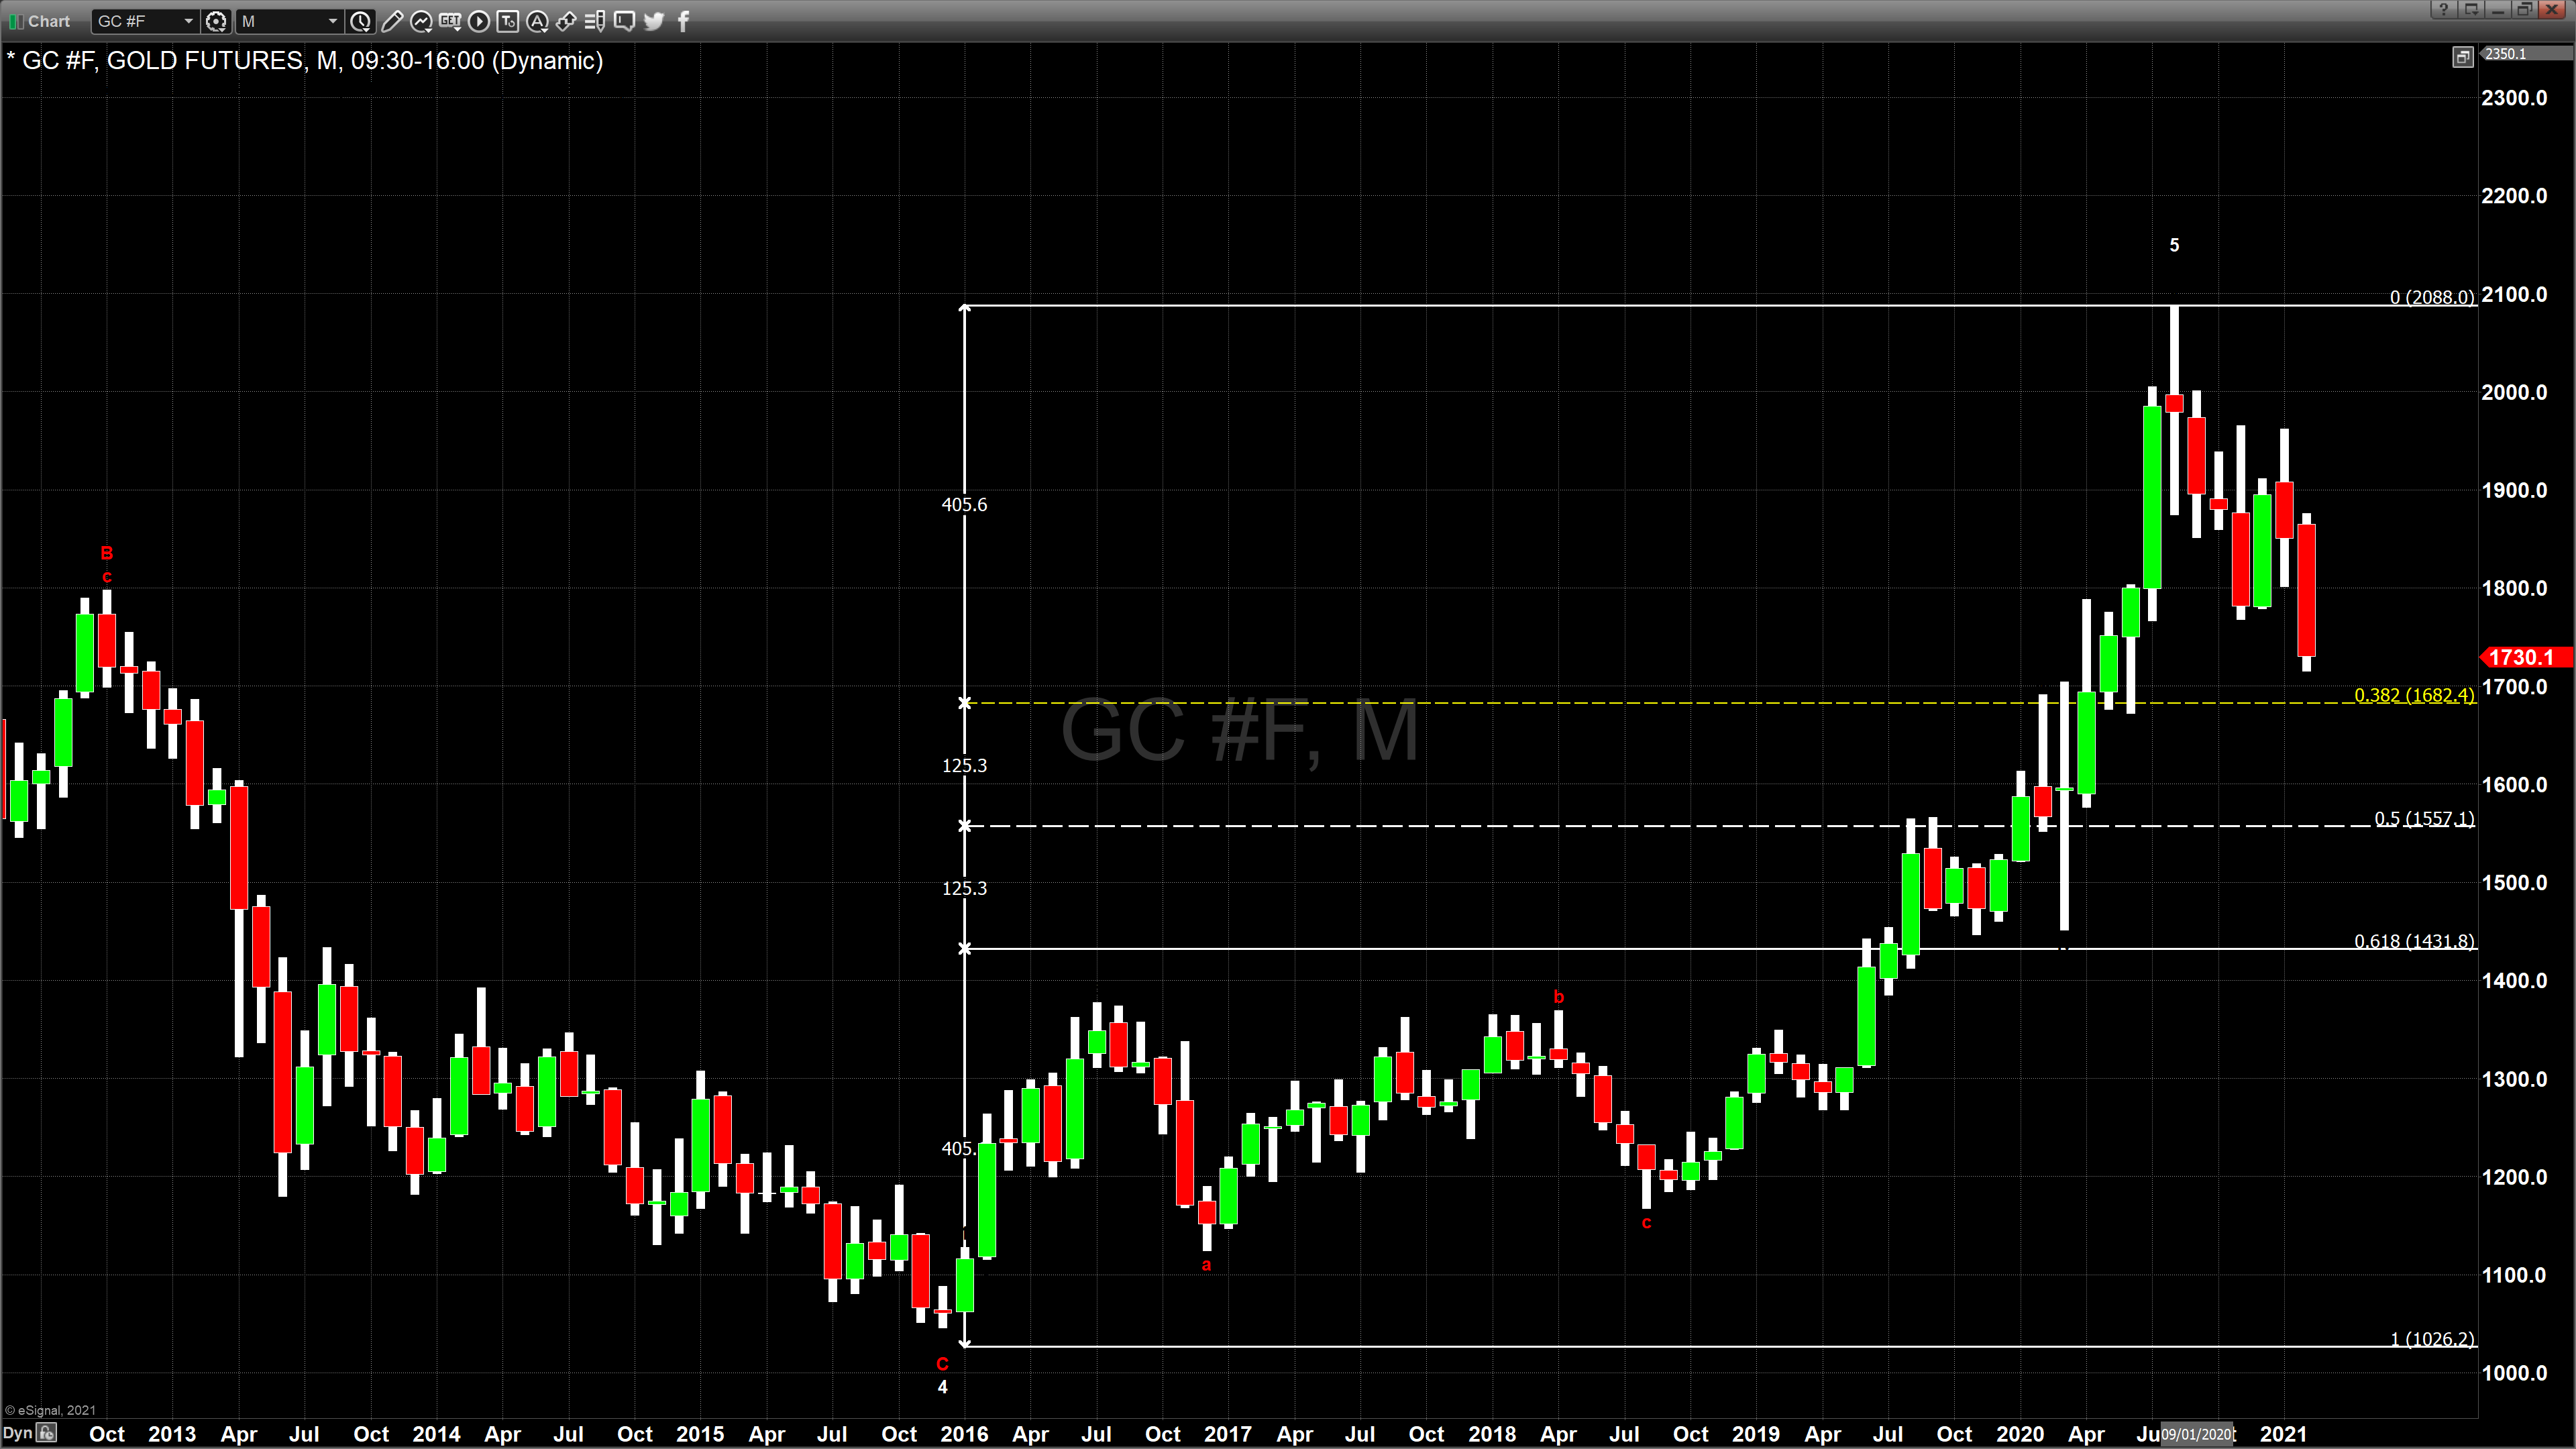
The last chart, chart 3, looks at a Fibonacci retracement of the fifth wave, which began at $1020 and concluded at the all-time record high of $2088, which occurred in August of last year. A typical correction consists of a 38.2% Fibonacci retracement or a Fibonacci retracement of .618%. In its most simplistic form, the correction will unfold as a series of three waves. The first wave of a correction will move in the opposite direction of the trend. The second wave of a correction will move in the direction of the trend and is labeled as a B wave. Lastly, there is typically a C wave which will usually trade below the A wave.
Our technical studies indicate that currently, we are in a long-term A wave which I believe could conclude at approximately $1682. This would be followed by a rally (wave B) that would trade roughly between 50% and 75% of the decline witnessed in the first corrective wave, wave A.
Chart 4
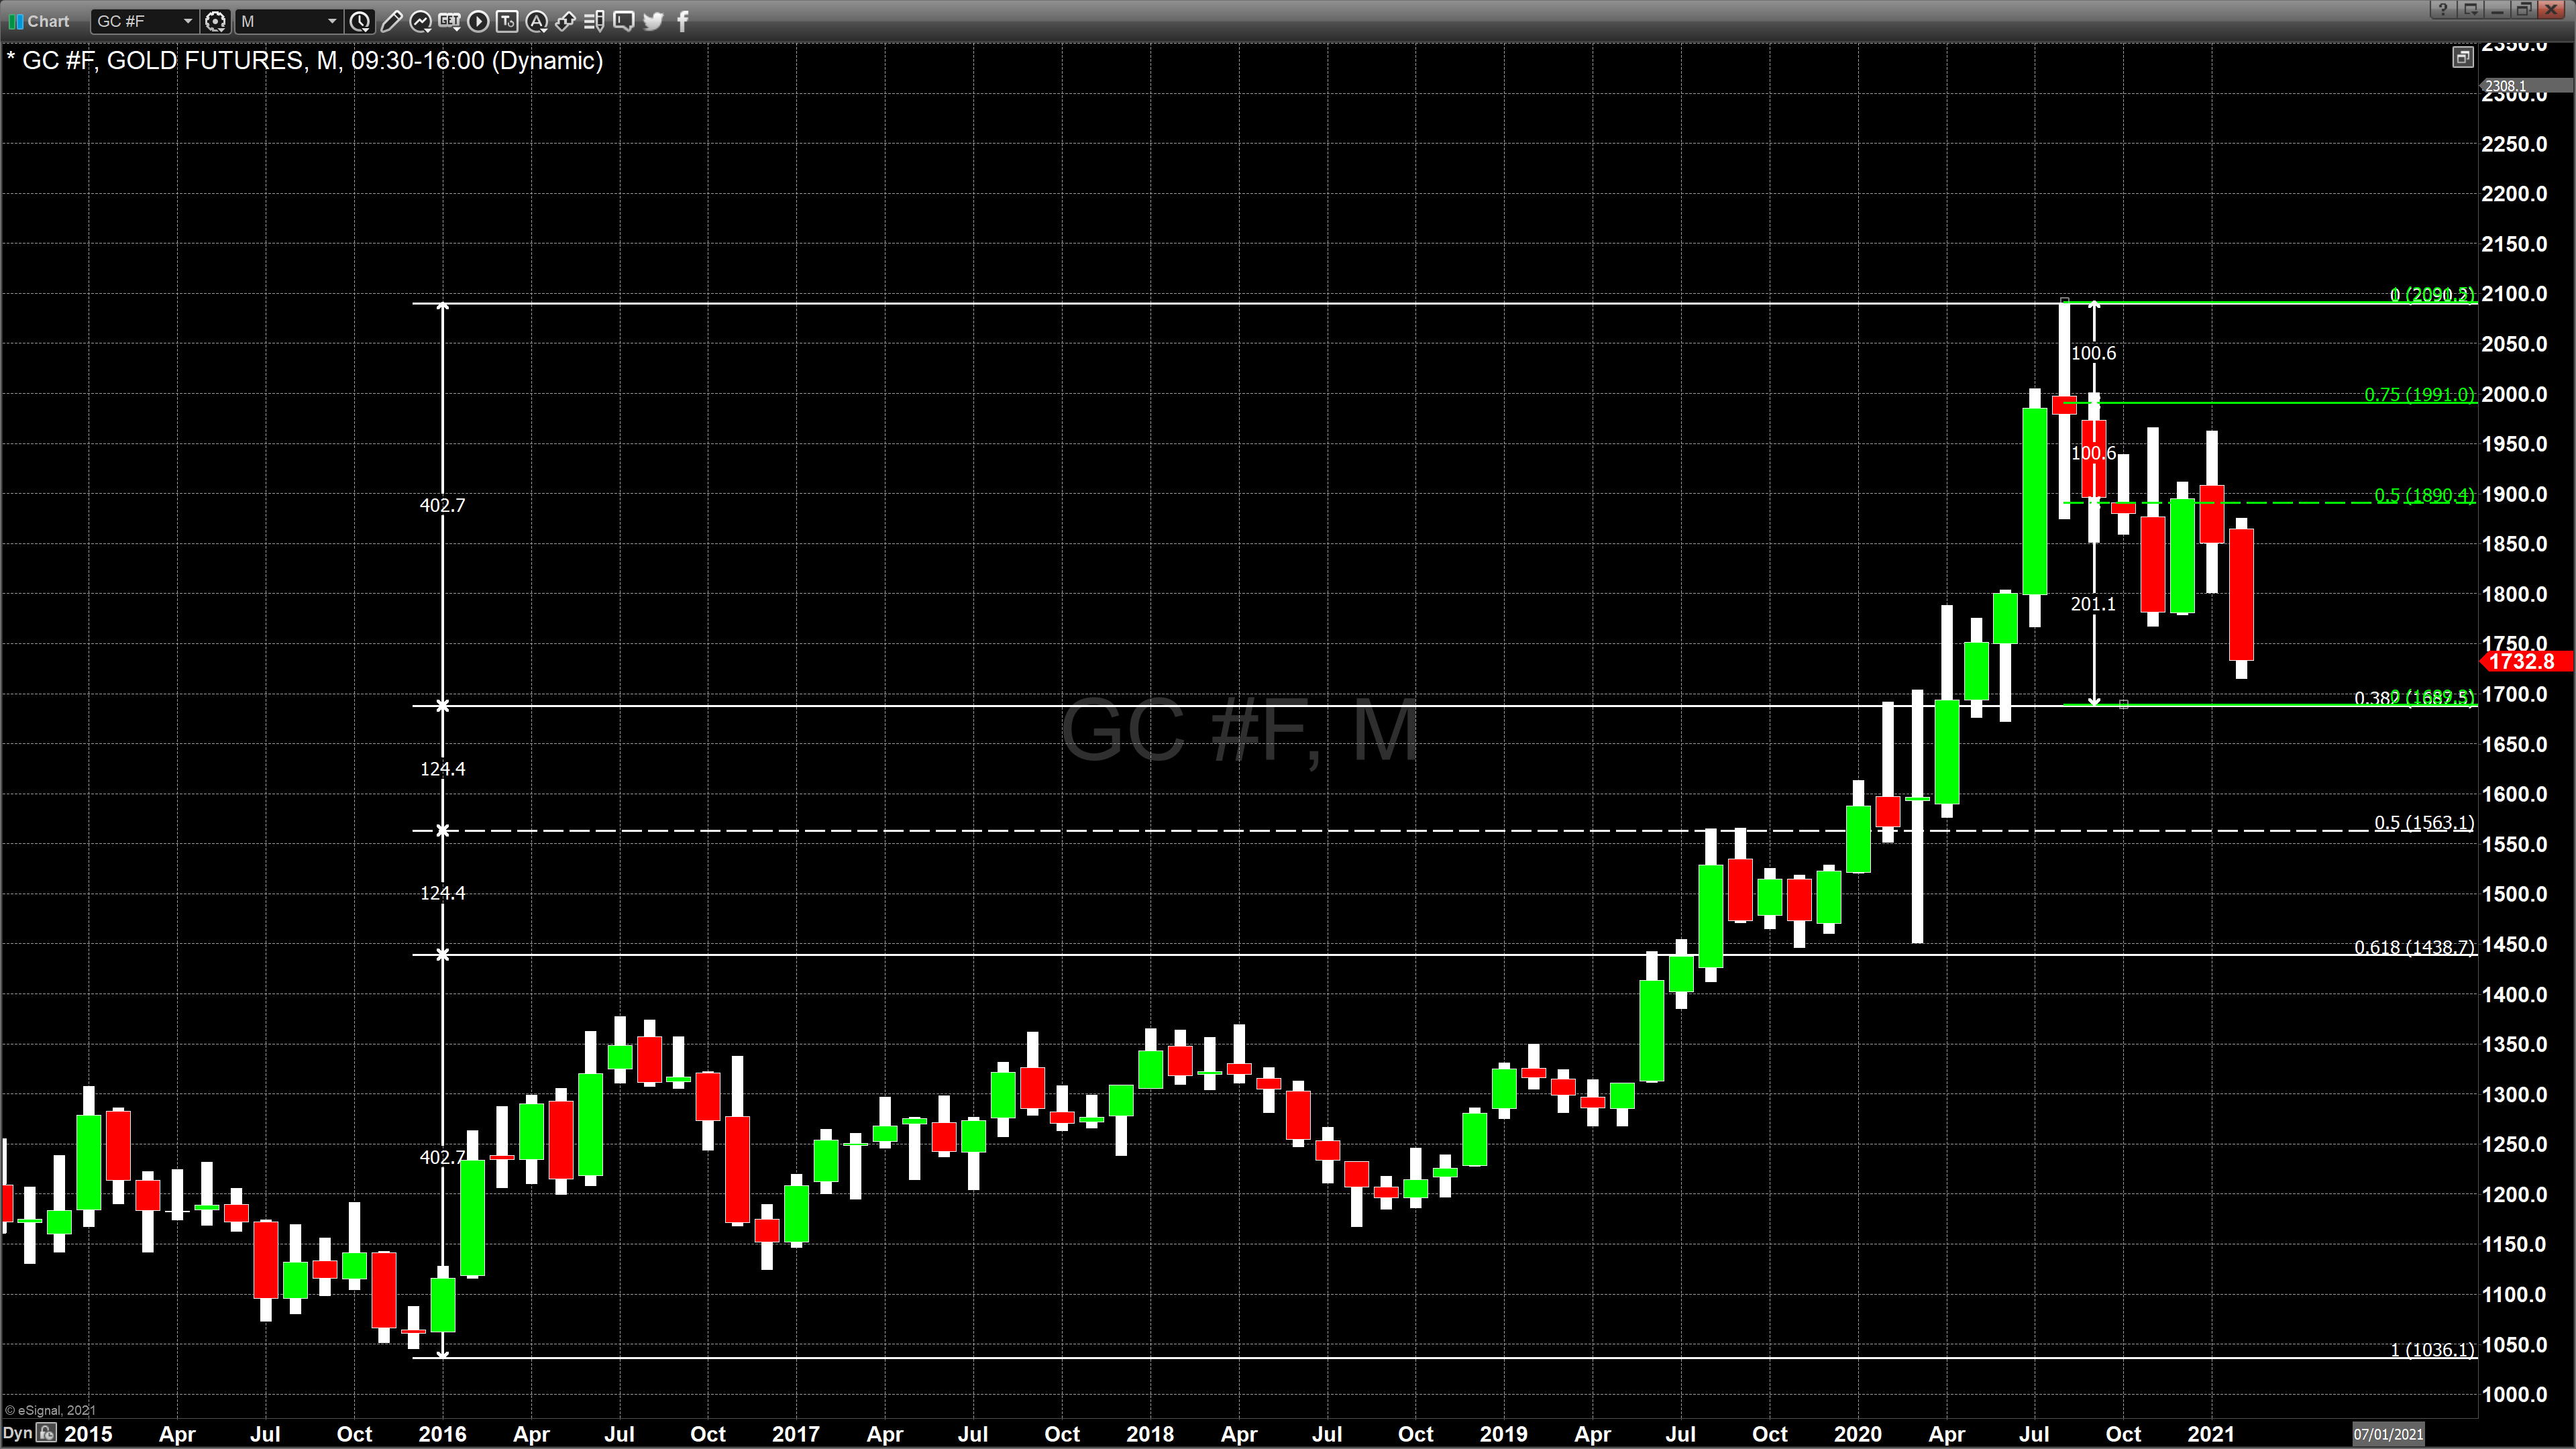
Chart four creates a model assuming that the first leg of this correction will take gold pricing to $1690, the 32.8% Fibonacci retracement of the fifth wave. Furthermore, it projects that wave B will unfold as a rally, taking gold from just below $1700 to between $1890 and $1990.
For more information on our service, simply use this link.
Wishing you, as always, good trading and good health,
Gary S. Wagner
About the Author
Gary S.Wagnercontributor
Gary S. Wagner has been a technical market analyst for 35 years. A frequent contributor to STOCKS & COMMODITIES Magazine, he has also written for Futures Magazine as well as Barron’s. He is the executive producer of "The Gold Forecast," a daily video newsletter. He writes a daily column “Hawaii 6.0” for Kitco News
Did you find this article useful?
Latest news and analysis


Advertisement