
Advertisement
Advertisement
Ethereum, Litecoin, and Ripple’s XRP – Daily Tech Analysis – February 27th, 2021
By:
It's a bullish start to the day. The majors will need to revisit early morning highs, however, to avoid another day in the red.

Ethereum
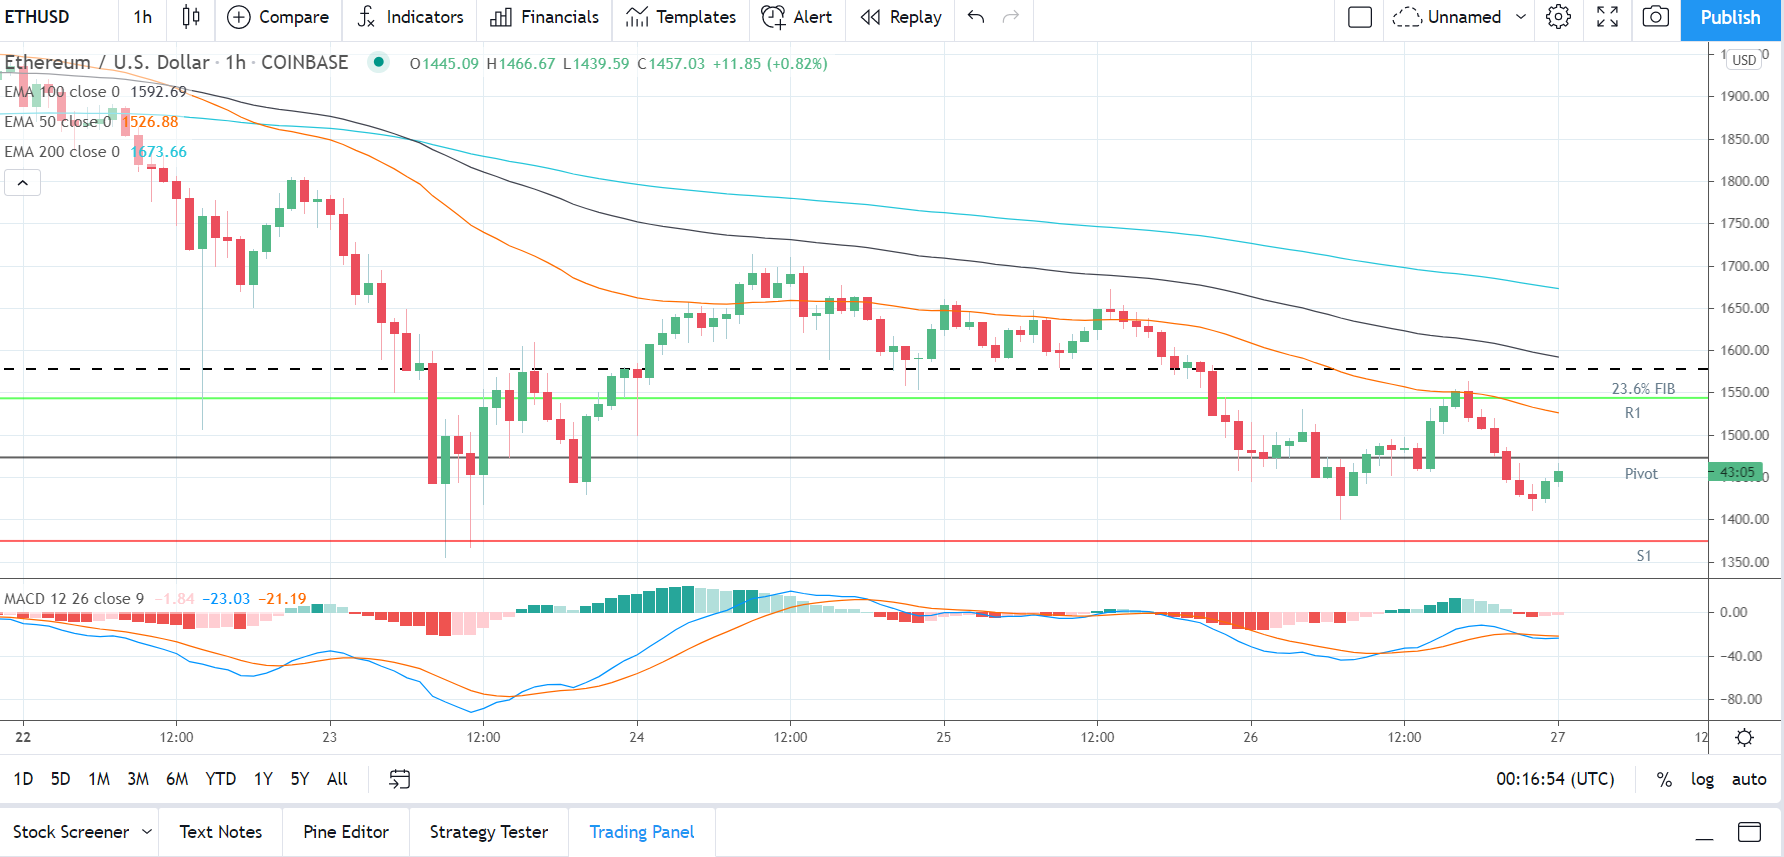
Ethereum fell by 2.49% on Friday. Following on from an 8.78% slide on Thursday, Ethereum ended the day at $1,445.18.
A mixed start to the day saw Ethereum rise to an early morning high $1,530.00 before hitting reverse.
Falling well short of the major resistance levels and 23.6% FIB of $1,579, Ethereum fell to a mid-morning intraday low $1,400.01.
Finding support at the first major support level at $1,403, Ethereum struck a late afternoon intraday high $1,564.11.
Falling short of the 23.6% FIB and the first major resistance level at $1,617, Ethereum slid back to $1,411 levels before steadying.
At the time of writing, Ethereum was up by 0.82% to $1,457.03. A mixed start to the day saw Ethereum fall to an early morning low $1,439.59 before rising to a high $1,466.67
Ethereum left the major support and resistance levels untested early on.
For the day ahead
Ethereum would need to move through the pivot level at $1,470 to support a run at the first major resistance level at $1,540.
Support from the broader market would be needed, however, for Ethereum to break back through to $1,500 levels.
Barring an extended crypto rally, the first major resistance level and 23.6% FIB of $1,579 would likely cap any upside.
In the event of a breakout, Ethereum could test resistance at $1,700 before any pullback. The second major resistance level sits at $1,634.
Failure to move through the $1,470 pivot would bring the first major support level at $1,375 into play.
Barring another extended sell-off, however, Ethereum should steer clear of the 38.2% FIB of $1,292. The second major support level at $1,306 should limit the downside.
Looking at the Technical Indicators
First Major Support Level: $1,375
Pivot Level: $1,470
First Major Resistance Level: $1,540
23.6% FIB Retracement Level: $1,579
38.2% FIB Retracement Level: $1,292
62% FIB Retracement Level: $830
Litecoin
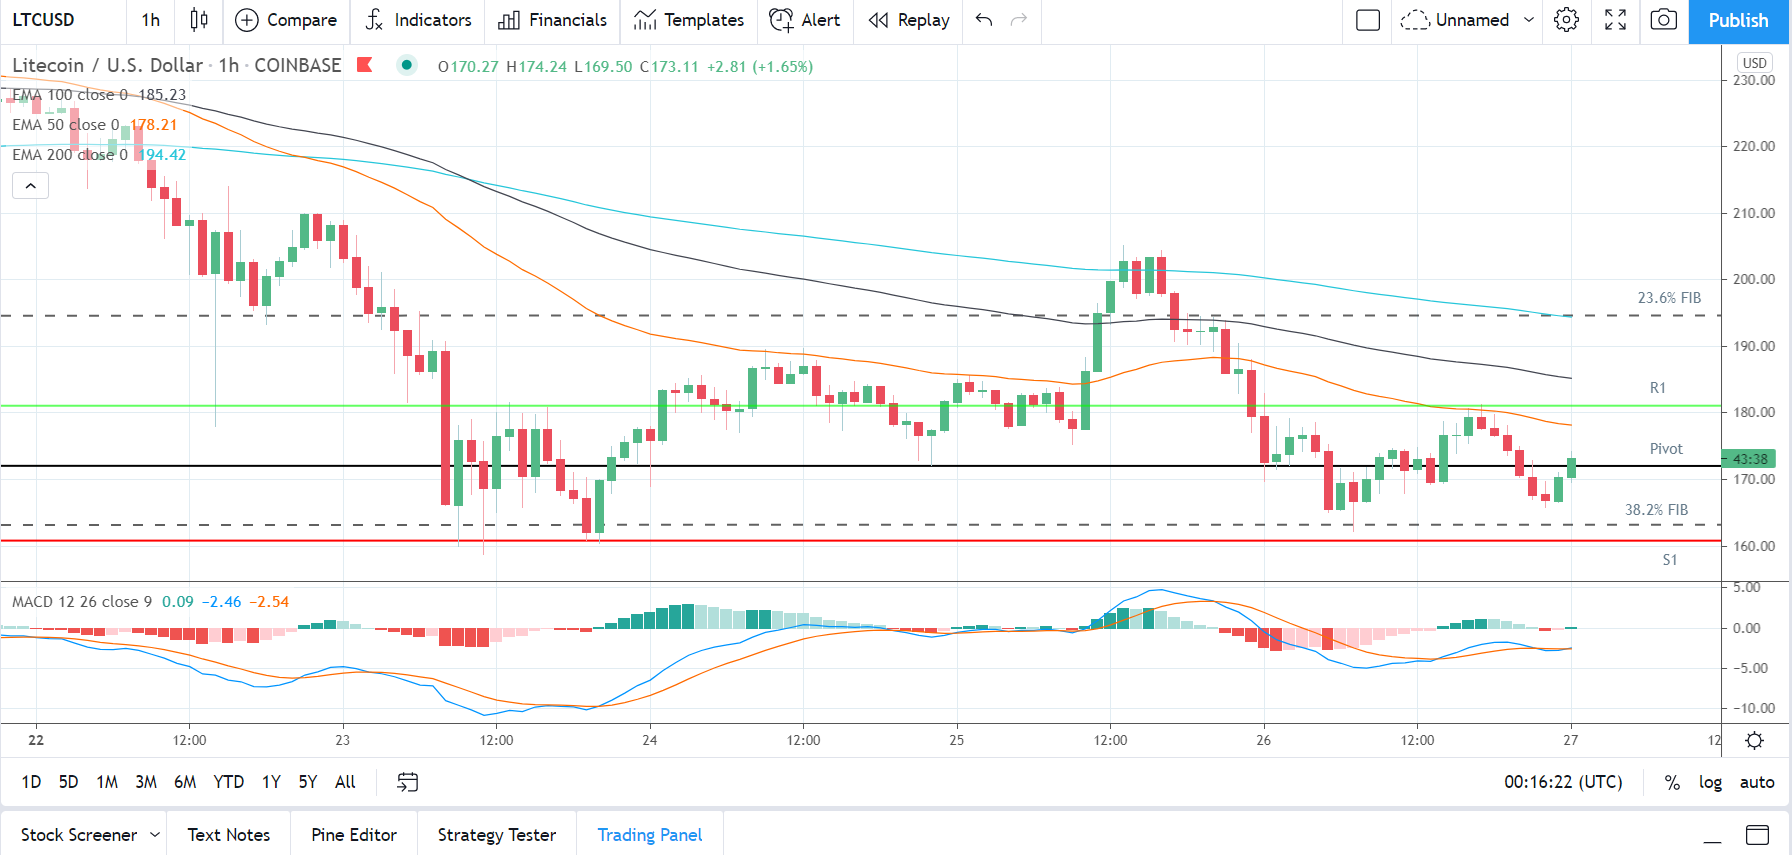
Litecoin slid by 5.07% on Friday. Following on from a 1.17% decline on Thursday, Litecoin ended the day at $170.30.
It was a mixed start to the day. Litecoin rose to an early morning intraday high $182.90 before hitting reverse.
Falling short of the 23.6% FIB of $195 and the first major resistance level at $198.04 Litecoin fell to a late morning intraday low $162.23.
The sell-off saw Litecoin fall through the first major support level at $168.05 and the 38.2% FIB of $163.
Finding late morning support, Litecoin revisited $181 levels before falling back to end the day at $170 levels.
At the time of writing, Litecoin was up by 1.65% to $173.11. A mixed start to the day saw Litecoin fall to an early morning low $169.50 before rising to a high $174.24.
Litecoin left the major support and resistance levels untested early on.
For the day ahead
Litecoin would need to avoid a fall through the $171.81 pivot level to support a run at the first major resistance level at $181.39.
Support from the broader market would be needed, however, for Litecoin to break back through to $180 levels.
Barring an extended crypto rally, the first major resistance level and Friday’s high $182.90 would likely cap any upside.
In the event of an extended breakout, Litecoin could test the second major resistance level at $192.48 and 23.6% FIB of $195.
Failure to avoid a fall through the $171.81 pivot level would bring the 38.2% FIB of $163 and the first major support level at $160.72 into play.
Barring another extended sell-off, Litecoin should steer clear of the second major support level at $151.14.
Looking at the Technical Indicators
First Major Support Level: $160.72
Pivot Level: $171.81
First Major Resistance Level: $181.39
23.6% FIB Retracement Level: $195
38.2% FIB Retracement Level: $163
62% FIB Retracement Level: $110
Ripple’s XRP
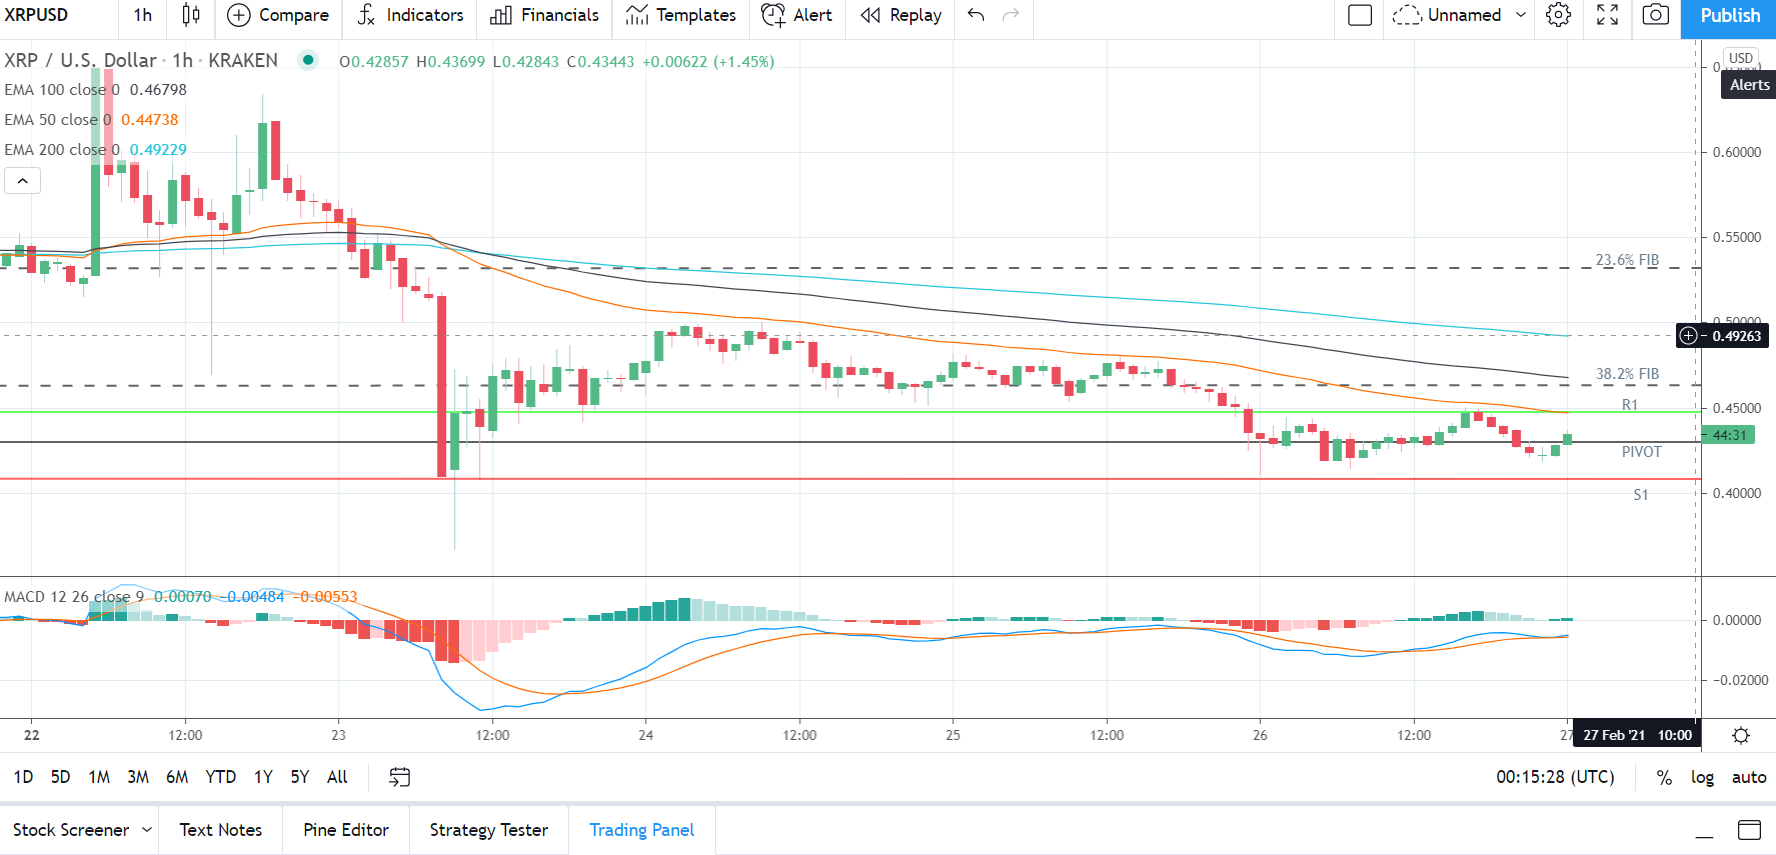
Ripple’s XRP fell by 1.54% on Friday. Following on from a 6.93% slide on Thursday, Ripple’s XRP ended the day at $0.42821.
A bearish start to the day saw Ripple’s XRP slide to an early morning intraday low $0.41137.
Finding support at the first major support level at $0.4133, Ripple’s XRP rose to a late afternoon intraday high $0.45030.
Falling well short of the first major resistance level at $0.4700, however, Ripple’s XRP fell back to sub-$0.42 levels before finding support.
A late move back through to $0.42 levels reduced the deficit on the day.
At the time of writing, Ripple’s XRP was up by 1.45% to $0.43443. A mixed start to the day saw Ripple’s XRP fall to an early morning low $0.42843 before rising to a high $0.43699.
Ripple’s XRP left the major support and resistance levels untested early on.
For the day ahead
Ripple’s XRP will need to avoid a fall back through the $0.4300 pivot level to bring the first major resistance level at $0.4486 into play.
Support from the broader market would be needed, however, for Ripple’s XRP to break out from $0.4500 levels.
Barring an extended crypto rally, the first major resistance level and Friday’s high $0.4503 should cap any upside.
In the event of an extended rally, Ripple’s XRP could test resistance at the 38.2% FIB of $0.4632 and the second major resistance level at $0.4689.
Failure to avoid a fall through the $0.4300 pivot would bring the first major support level at $0.4096 into play.
Barring another extended sell-off, however, Ripple’s XRP should steer clear of sub-$0.40 levels. The second major support level sits at $0.3910.
Looking at the Technical Indicators
First Major Support Level: $0.4096
Pivot Level: $0.4300
First Major resistance Level: $0.4486
23.6% FIB Retracement Level: $0.5320
38.2% FIB Retracement Level: $0.4632
62% FIB Retracement Level: $0.3521
Please let us know what you think in the comments below.
Thanks, Bob
About the Author
Bob Masonauthor
With over 20 years of experience in the finance industry, Bob has been managing regional teams across Europe and Asia and focusing on analytics across both corporate and financial institutions. Currently he is covering developments relating to the financial markets, including currencies, commodities, alternative asset classes, and global equities.
Did you find this article useful?
Latest news and analysis


Advertisement