Join Our Telegram channel to stay up to date on breaking news coverage
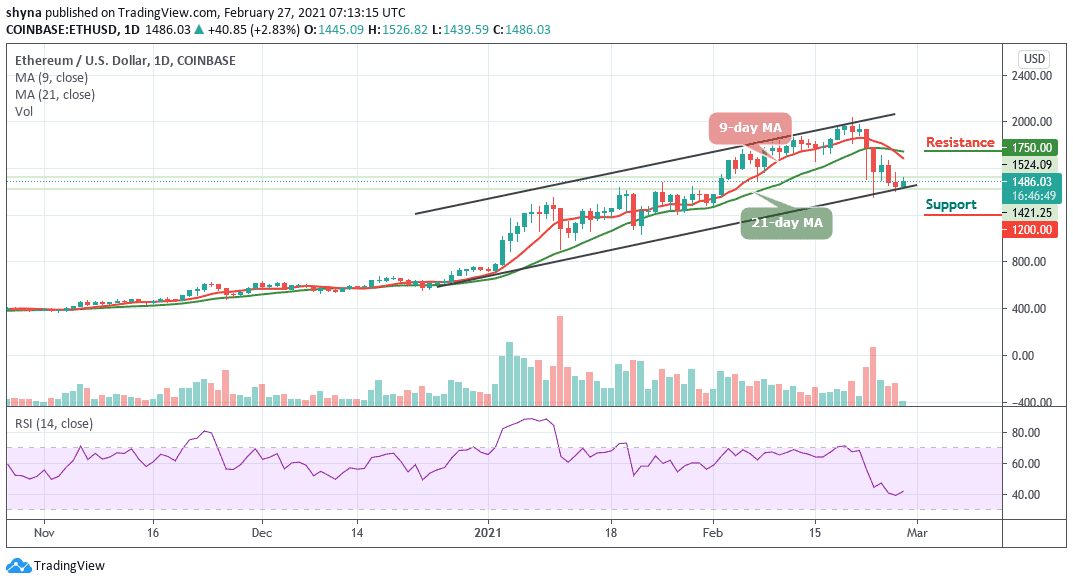
Bitcoin (BTC) Price Prediction – February 27
After some brief consolidation, BTC/USD is currently trading above $47,250.
BTC/USD Long-term Trend: Bullish (Daily Chart)
Key levels:
Resistance Levels: $54,000, $56,000, $58,000
Support Levels: $40,000, $38,000, $36,000
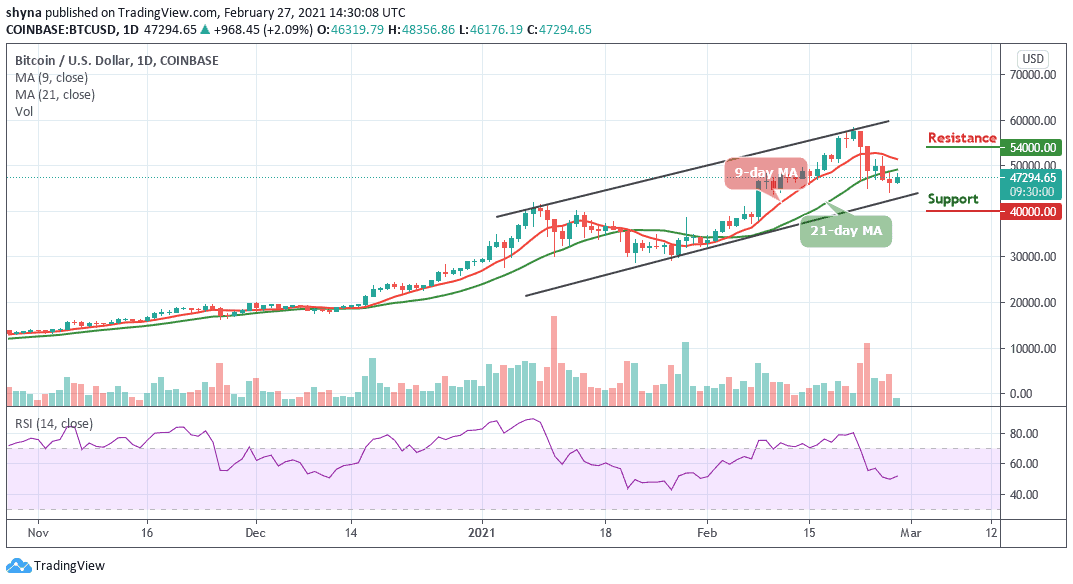
BTC/USD bulls are working so hard on breaking the resistance at $50,000; a move that could pave the way for gains above $55,000. The coin is currently settling above $47,000 while the further recovery is limited by the local resistance of $46,000. However, the recent dip that occurred in the last few days was actually helpful for Bitcoin as the technical indicator RSI (14) moves around 50-level as the coin is getting ready for the next leg up.
Would Bitcoin Go Up or Down?
The Bitcoin price has refused to budge and remains in consolidation in spite of a breakout towards the moving averages. The bulls have established a higher low and only need to climb above $50,500 to confirm a daily uptrend. Presently, the trend is coming to favor the bulls and if the situation remains unchanged, BTC/USD may continue likely grind north.
Moreover, the resistance is anticipated at $46,800 and $47,000. If the coin brings down the seller congestion in these areas, there is a chance that a new path to $54,000, $56,000, and $58,000 resistance levels may be created. For now, all the attention should go towards overcoming the hurdle at $50,000 and defending support at $47,000. Meanwhile, going below $45,000 may likely seek supports at $40,000, $38,000, and $36,000 respectively.
BTC/USD Medium-Term Trend: Bearish (4H Chart)
On the 4-hour chart, there are several important technical barriers below and above the current price at the $47,185 level. This means that BTC/USD may spend enough time consolidating gains at the current levels as the RSI (14) moves sideways.
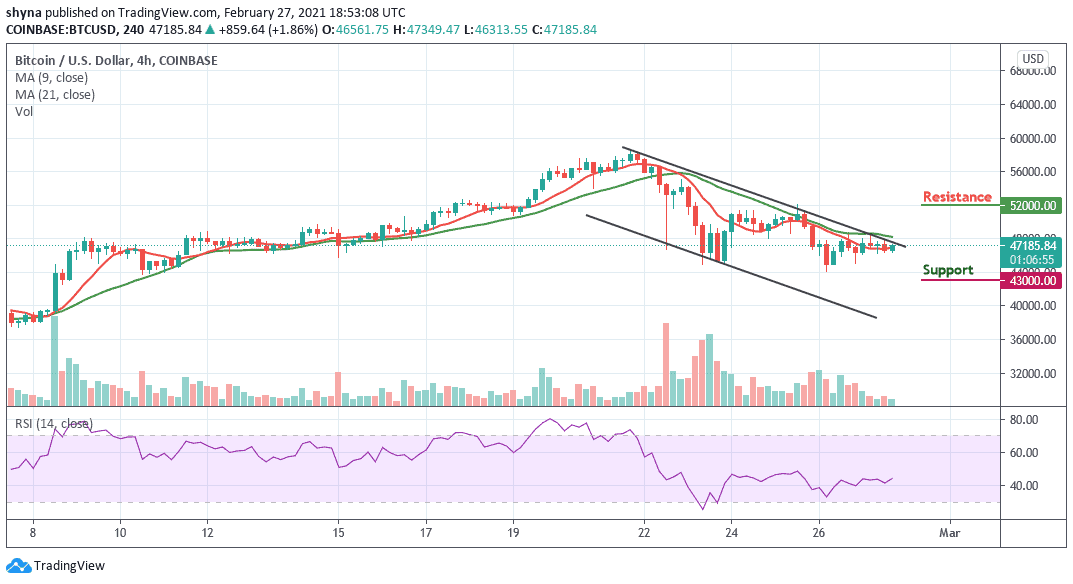
Meanwhile, in the long-run, the trend stays bullish as long as the price is above $47,000. The potential resistance level is located at $52,000 and above while the nearest supports are the moving averages at $43,000 and below.
Join Our Telegram channel to stay up to date on breaking news coverage