
Soybean – Just Another Measure Of Inflation
If inflation is a measure of anything it is in the soft commodities where we are likely to see the first signs developing, and therefore it is no surprise to see where prices are heading in the medium term when we look at the weekly charts for soybean, wheat, and corn which have been rising strongly since August last year. The chart here is for ZS soybean, but could equally be of wheat or corn which have also demonstrated strong gains.
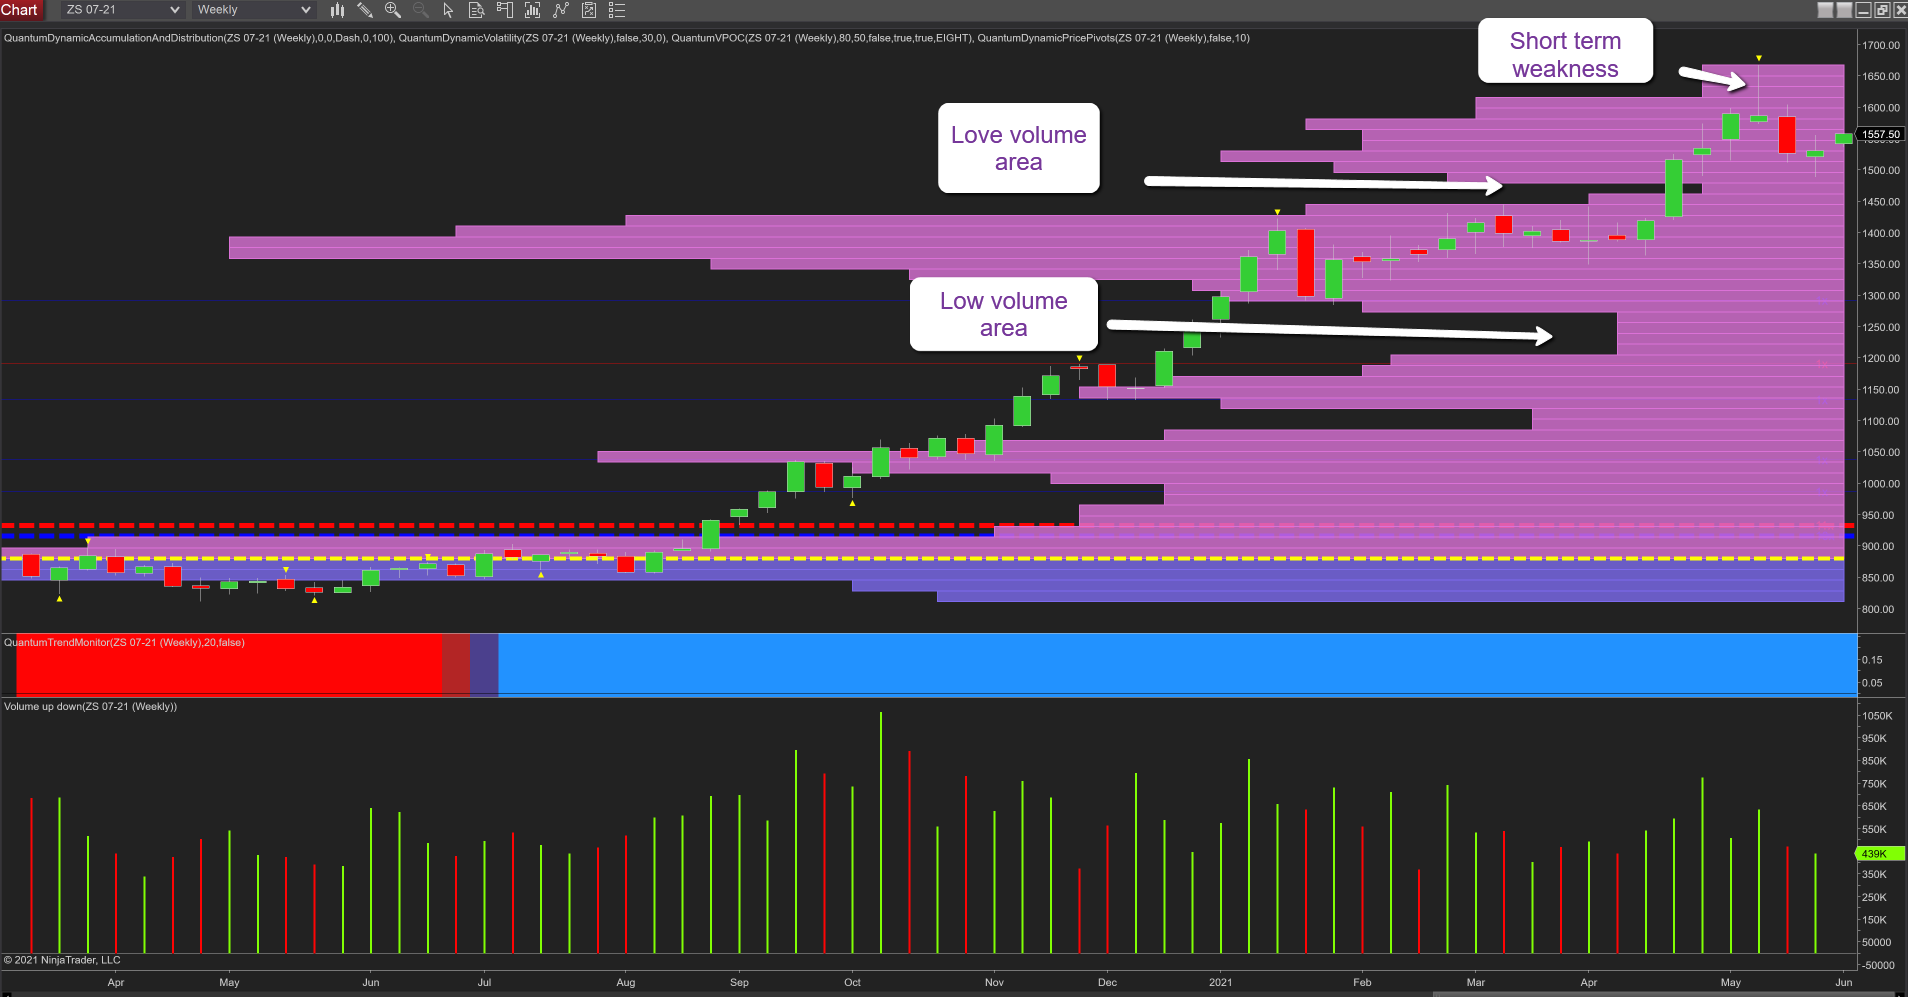
The breakout started in September moving strongly away from the volume point of control denoted with the yellow dashed line where the price had congested around the $ 9-bushel price before accelerating through the $10 per bushel and on towards the $14 per bushel area where a further period of sideways price action ensued. The rally of April added further momentum with the commodity moving swiftly through the low volume region on the VPOC histogram at $14.50 per bushel before the rally was capped off with the dramatic candle of four weeks ago on good volume, and as expected the price weakened to test $15 per bushel once more driven by better than expected harvest forecasts. Despite this, however, bullish momentum remains strong, and with the market trading higher at $15.56 per bushel following a gapped up open with a return to $16 per bushel now likely given the volume which falls away on the VPOC histogram. All of which means only one thing, higher food prices which will ultimately drive inflation.
(Click on image to enlarge)
Disclaimer: Futures, stocks, and spot currency trading have large potential rewards, but also large potential risk. You must be aware of the risks and be willing to accept them in order to invest in ...
more

