
British Pound Technical Analysis: GBP/AUD, GBP/CAD, GBP/NZD Rates Outlook
With May in the rearview mirror, it’s a good time to take stock of the British Pound’s performance against some of the more volatile major currencies, which were plagued by – you guessed it – volatile if not weaker commodity prices over the course of the month. While currencies linked to energy may be the exception to the rule, those with strong economic connections to agriculture and base metals faced tougher sledding (particularly the latter).
The net result was rangebound price action in GBP/CAD and GBP/NZD rates, which has been the modus operandi for quite some time. But decision time may be arriving for pairs like GBP/CAD and GBP/NZD as they funnel into the vertexes of their respective symmetrical triangles.
Meanwhile, GBP/AUD rates were able to generate more topside momentum through May although recently were rejected from a multi-decade trendline dating back to the all-time high in October 2008. This may be a temporary setback before another breakout attempt (like in 2020).
GBP/AUD RATE TECHNICAL ANALYSIS: WEEKLY CHART (JULY 2008 TO JUNE 2021) (CHART 1)
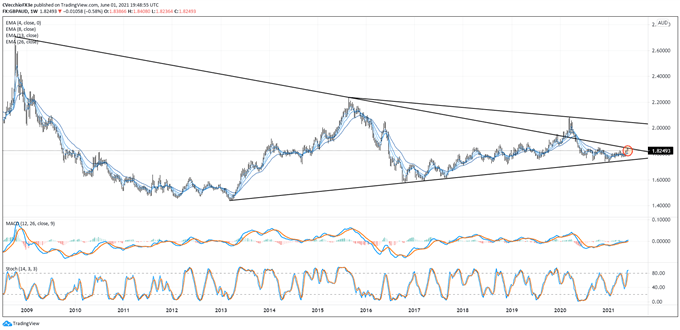
To provide greater context to the prior comment, the weekly chart of GBP/AUD rates shows how the pair is currently contending with two longer-term technical structures. The first interpretation is that GBP/AUD rates were just rejected at the descending trendline from the 2008 and 2015 highs, a trendline that it previously breached for a few weeks in 2020 before turning lower. In true ‘false breakout’ fashion, the pair reversed all the way to consolidation support before resuming its march higher.
The second interpretation is that, even with a rejection from the descending trendline from the 2008 and 2015 highs, GBP/AUD rates are in the middle of a symmetrical triangle that’s formed with resistance measured from the 2015 and 2020 highs and support measured from the 2013 and 2016 lows.
Regardless of which interpretation is correct (or neither), the fact remains that bullish momentum is building in GBP/AUD rates unlike the other two GBP-crosses covered in this report. Weekly MACD is rising through its signal line, while weekly Slow Stochastics are holding in overbought territory. GBP/AUD rates appears to be on the precipice of a more significant trek higher. Is that time now? Perhaps not.
GBP/AUD RATE TECHNICAL ANALYSIS: DAILY CHART (MARCH 2020 TO JUNE 2021) (CHART 2)
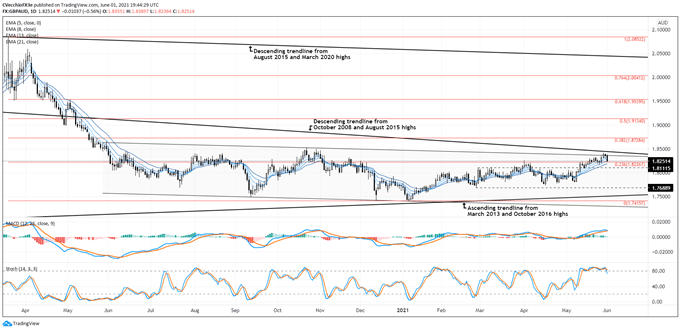
GBP/AUD rates have carved out a series of ‘higher highs and higher lows’ in January, February, April, and now May. In doing so, the pair finally broke above the 23.6% Fibonacci retracement of the 2020 high/2021 low range at 1.8227 before finding resistance in the around 1.8327, which has proved resistance since November 2020. If the technical structure has been largely supportive, it’s also true that the daily timeframe hints of eroding confidence at the start of the month.
But the crucial fact in the near-term may be the case that while GBP/USD rates have a bearish seasonal tendency for June, AUD/USD rates have enjoyed their best month of the year in June; this conjures a mix that favors GBP/AUD weakness. A deeper retrenchment may develop before GBP/AUD rates ultimately fulfill their longer-term bullish technical potential.
GBP/CAD RATE TECHNICAL ANALYSIS: DAILY CHART (MARCH 2020 TO JUNE 2021) (CHART 3)
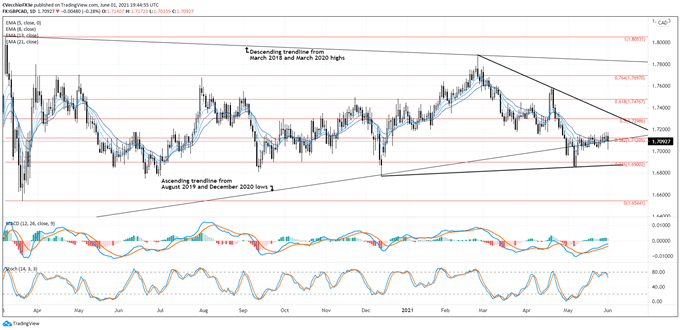
Choppiness is one way to describe GBP/CAD price action over the past month. The pair has been tethered to the 38.2% Fibonacci retracement (1.7121) as well as the ascending trendline from the August 2019 and December 2020 lows for several weeks.
Momentum has been slowly turning more bullish, but without much follow through. GBP/CAD rates are below their daily 5-, 8-, 13- EMAs but above their daily 21-EMA, which is in neither bearish nor bullish sequential order. Daily Slow Stochastics are pulling back from overbought territory, while daily MACD has been rising towards its signal line while in bearish territory. More clarity is needed before a directional bias is ascertained.
GBP/NZD RATE TECHNICAL ANALYSIS: DAILY CHART (FEBRUARY 2020 TO JUNE 2021) (CHART 4)
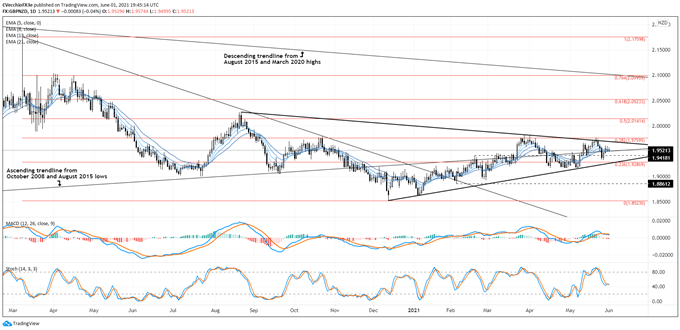
GBP/NZD rates are coiling into the vertex of the 10-month symmetrical triangle while playing ping pong the 23.6% (1.9287) and 38.2% (1.9760) Fibonacci retracements of the 2020 high/2021 low range, all the while riding along the ascending trendline from the October 2008 and August 2015 lows.
Directional bias is lacking, as is momentum: the EMA envelope is in neither bearish nor bullish sequential order; daily MACD is flat, just above its signal line; and daily Slow Stochastics are flat, just above their median line. More patience is required, but it appears that a breakout may be coming soon.


