- AUD/JPY catches a breather during the week’s recovery moves.
- MACD teases bears but needs validation from the stated channel.
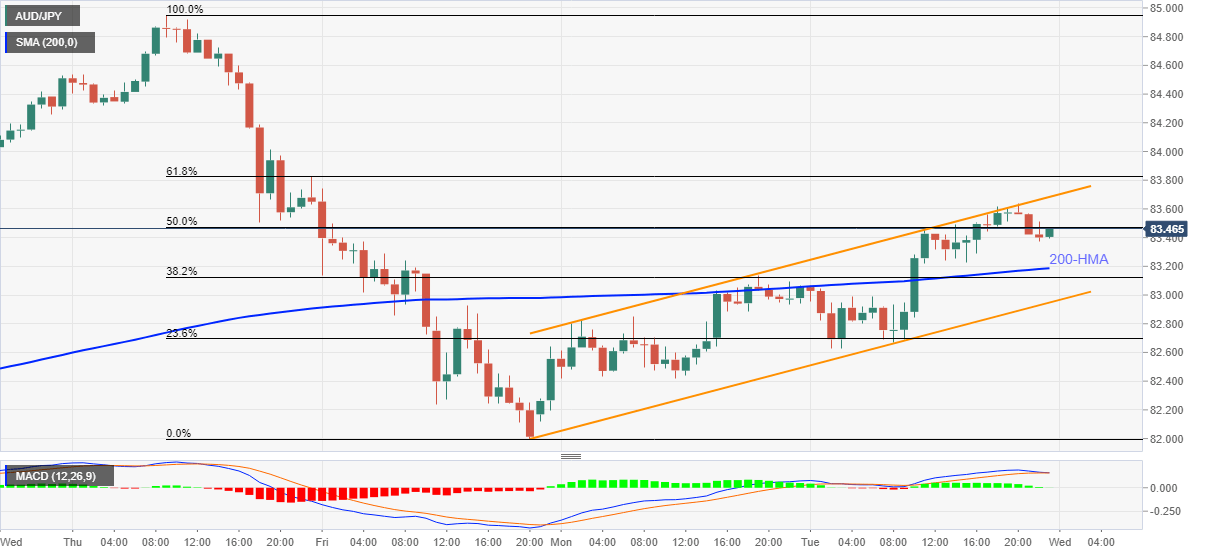
- Key Fibonacci retracement levels will probe buyers outside the bullish pattern.
AUD/JPY fades the early week's corrective pullback while stepping back to 83.43, despite keeping the bullish chart formation, during the initial Asian session on Wednesday. In doing so, the quote eases from the upper line of the weekly ascending trend channel ahead of the fourth-quarter (Q4) Australia GDP data.
Read: Australian GDP Preview: Prospects for a sustained economic recovery
Given the cautious sentiment ahead of the key data, coupled with not upbeat expectations from GDP, AUD/JPY may extend the pullback moves towards the 200-HMA level of 83.18.
Also supporting the hopes of further weakness could be the MACD conditions that seem to tease bears.
However, AUD/JPY sellers are less likely to turn serious until witnessing an hourly close below the support line of the stated channel, at 82.95 now, which in turn should challenge the weekly bottom surrounding 82.00.
Meanwhile, an upside break of the channel’s resistance line, currently around 83.70, will have to cross the 61.8% Fibonacci retracement of February 25-26 downside, around 83.85, before recalling the AUD/JPY buyers.
Following that, the multi-month top posted in February around the 85.00 threshold will be the key to watch.
AUD/JPY hourly chart
Trend: Pullback expected
Information on these pages contains forward-looking statements that involve risks and uncertainties. Markets and instruments profiled on this page are for informational purposes only and should not in any way come across as a recommendation to buy or sell in these assets. You should do your own thorough research before making any investment decisions. FXStreet does not in any way guarantee that this information is free from mistakes, errors, or material misstatements. It also does not guarantee that this information is of a timely nature. Investing in Open Markets involves a great deal of risk, including the loss of all or a portion of your investment, as well as emotional distress. All risks, losses and costs associated with investing, including total loss of principal, are your responsibility. The views and opinions expressed in this article are those of the authors and do not necessarily reflect the official policy or position of FXStreet nor its advertisers. The author will not be held responsible for information that is found at the end of links posted on this page.
If not otherwise explicitly mentioned in the body of the article, at the time of writing, the author has no position in any stock mentioned in this article and no business relationship with any company mentioned. The author has not received compensation for writing this article, other than from FXStreet.
FXStreet and the author do not provide personalized recommendations. The author makes no representations as to the accuracy, completeness, or suitability of this information. FXStreet and the author will not be liable for any errors, omissions or any losses, injuries or damages arising from this information and its display or use. Errors and omissions excepted.
The author and FXStreet are not registered investment advisors and nothing in this article is intended to be investment advice.
Recommended content
Editors’ Picks
EUR/USD stays below 1.0700 after US data

EUR/USD stays in a consolidation phase below 1.0700 in the early American session on Wednesday. The data from the US showed a strong increase in Durable Goods Orders, supporting the USD and making it difficult for the pair to gain traction.
USD/JPY refreshes 34-year high, attacks 155.00 as intervention risks loom

USD/JPY is renewing a multi-decade high, closing in on 155.00. Traders turn cautious on heightened risks of Japan's FX intervention. Broad US Dollar rebound aids the upside in the major. US Durable Goods data are next on tap.
Gold trades on the back foot, manages to hold above $2,300

Gold struggles to stage a rebound midweek following Monday's sharp decline but manages to hold above $2,300. The benchmark 10-year US Treasury bond yield stays in the green above 4.6% after US data, not allowing the pair to reverse its direction.
Worldcoin looks set for comeback despite Nvidia’s 22% crash Premium

Worldcoin price is in a better position than last week's and shows signs of a potential comeback. This development occurs amid the sharp decline in the valuation of the popular GPU manufacturer Nvidia.
Three fundamentals for the week: US GDP, BoJ and the Fed's favorite inflation gauge stand out Premium

While it is hard to predict when geopolitical news erupts, the level of tension is lower – allowing for key data to have its say. This week's US figures are set to shape the Federal Reserve's decision next week – and the Bank of Japan may struggle to halt the Yen's deterioration.