
Bitcoin (BTC/USD), Ethereum (ETH/USD) Rallying Sharply As The Bulls Wrestle Back Control
A sea of green in the cryptocurrency space with some coins recording early double-digit gains. Last week’s sell-off has been absorbed and the technical picture for both Bitcoin and Ethereum now looks increasingly positive. As always with the cryptocurrency, the real reason for the move is never immediately clear although a few recent actions are likely to be put forward as drivers of the recent move. A recent tweet by the CEO of a South Korean crypto-analytics firm that the large Bitcoin trades recently indicate OTC-buying by cryptocurrency ‘whales’ will have buoyed the bulls, while Goldman Sachs is said to be firing up its cryptocurrency trading desk again and will begin trading bitcoin futures and non-deliverable forwards. In addition, cryptocurrency miner, publicly-quoted Argo Blockchain, today said that it will pay its CEO in Bitcoin and allow other employees to be in Bitcoin if they wish.
While in isolation these events may not spark a strong move, in combination they continue to point to increased adoption and interest in the space, a space that needs little news to spark a strong move. Emotion is a strong driver in the cryptocurrency market and if the recent move has taken out selling interest, then a fresh move higher looks the path of least resistance.
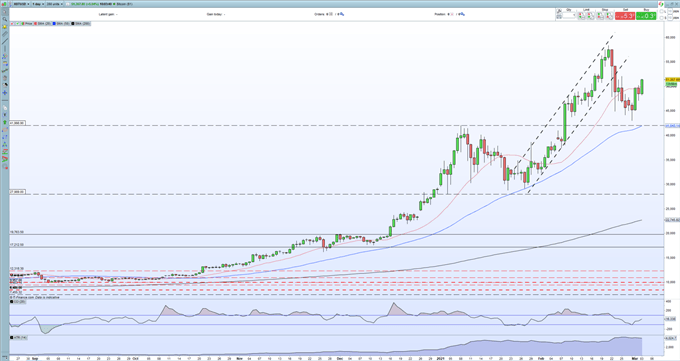
A look at the daily charts suggests that the recent sell-off is being pared back and if BTC/USD can regain its bullish channel, fresh all-time highs are likely.The CCI reading shows Bitcoin landed in oversold territory recently for the first time since late-January, with the previous oversold reading back in September 2020 when BTC traded around $10,000. It looks as though oversold signals have been drivers of strong rallies. The bullish channel is steep and BTC/USD will likely have to make a fresh all-time high to regain it.
Bitcoin (BTC/USD) Daily Price Chart (August 2020 - March 3, 2021)
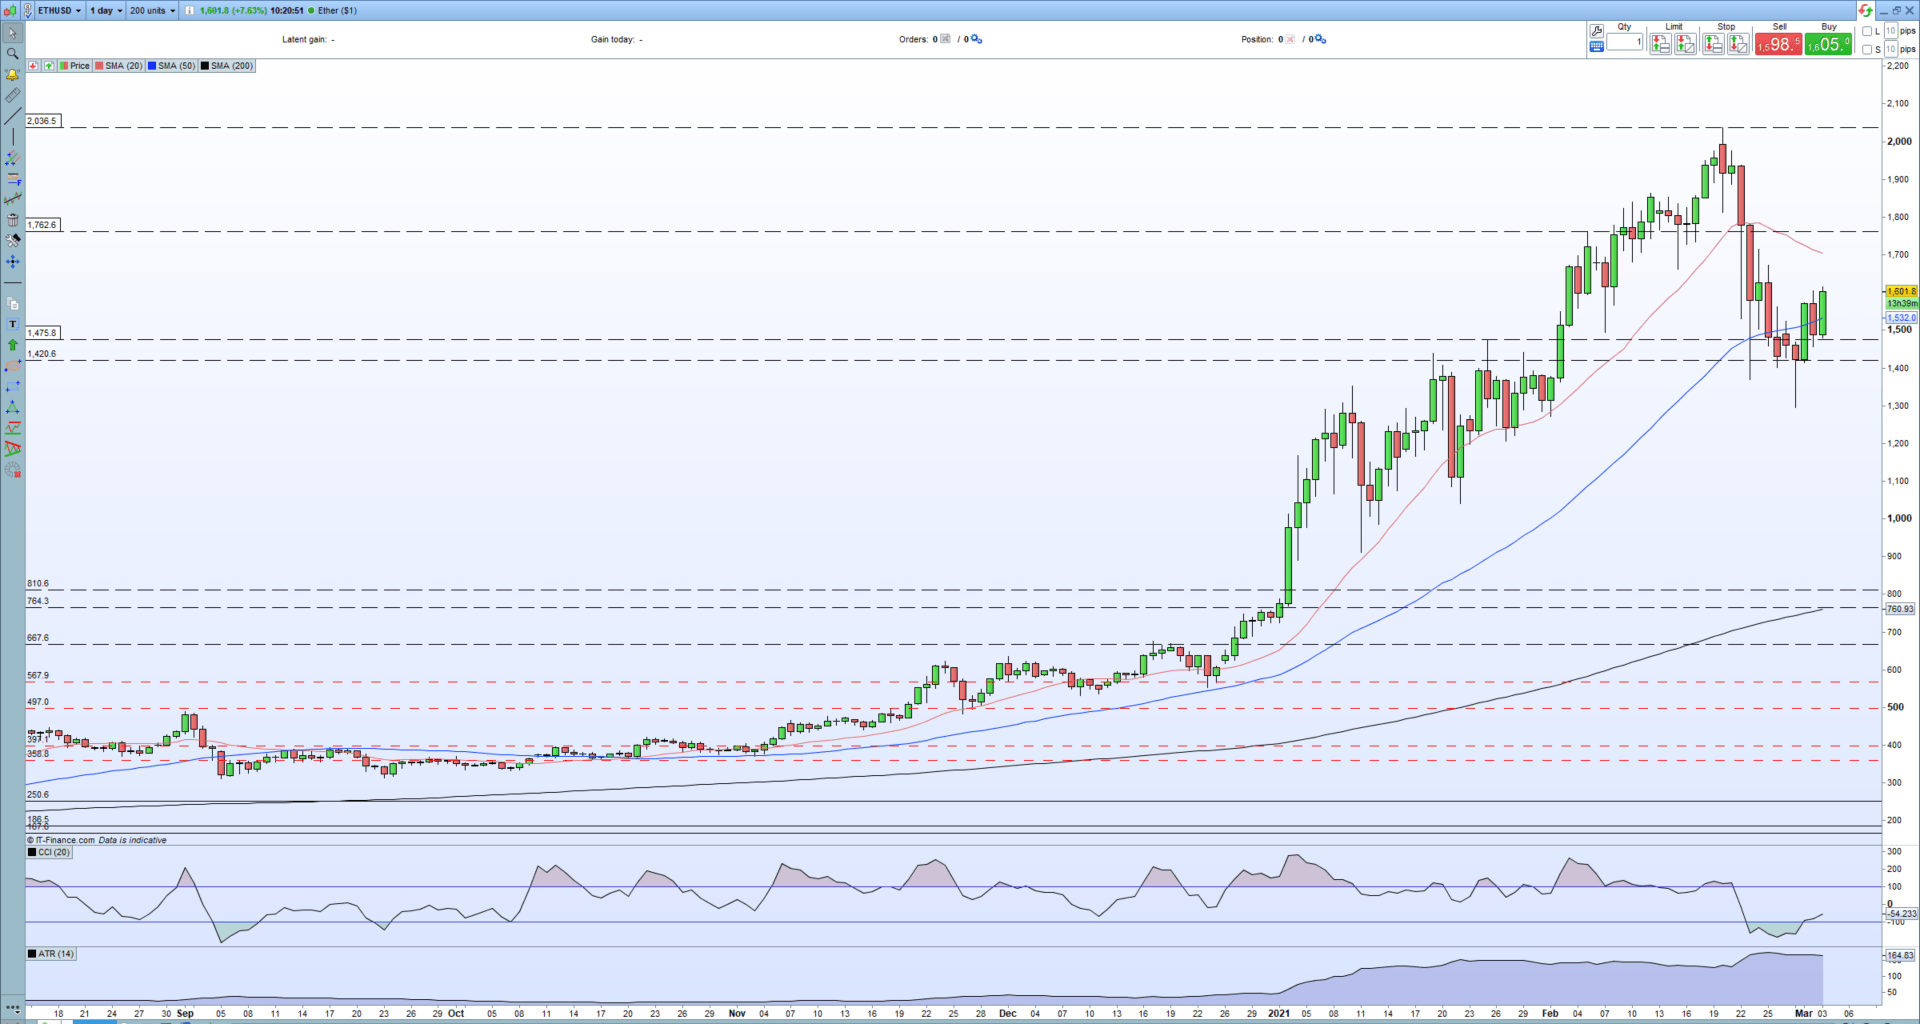
Ethereum (ETH/USD) continues its pullback from the late-February sell-off and is looking to re-test $1,700 and potentially higher. Again the CCI indicator highlighted heavily oversold conditions, while the 50-day simple moving average helped to stem the sell-off and if closed and opened above will turn into stronger support. The next area of resistance lies between $1,700 and $1,780 before the February 20 high of $2,036 comes into play.
Etherem (ETH/USD) Daily Price Chart (August 2020 - March 3, 2021)
(Click on image to enlarge)
Disclosure: See the full disclosure for DailyFX here.


