
Advertisement
Advertisement
DAX 30 Correction in Uptrend Aims at 15,000 and 15,700 Targets
By:
German stock index DAX 30 has reached a critical -61.8% Fibonacci target zone. Will price action show a bearish reversal or a bullish trend?
In this article:
The German stock index DAX 30 has reached a critical -61.8% Fibonacci target zone. Will price action show a bearish reversal or a bullish trend?
This article explains why an uptrend breakout has a better probability. We also review the main patterns and targets.
Price Charts and Technical Analysis
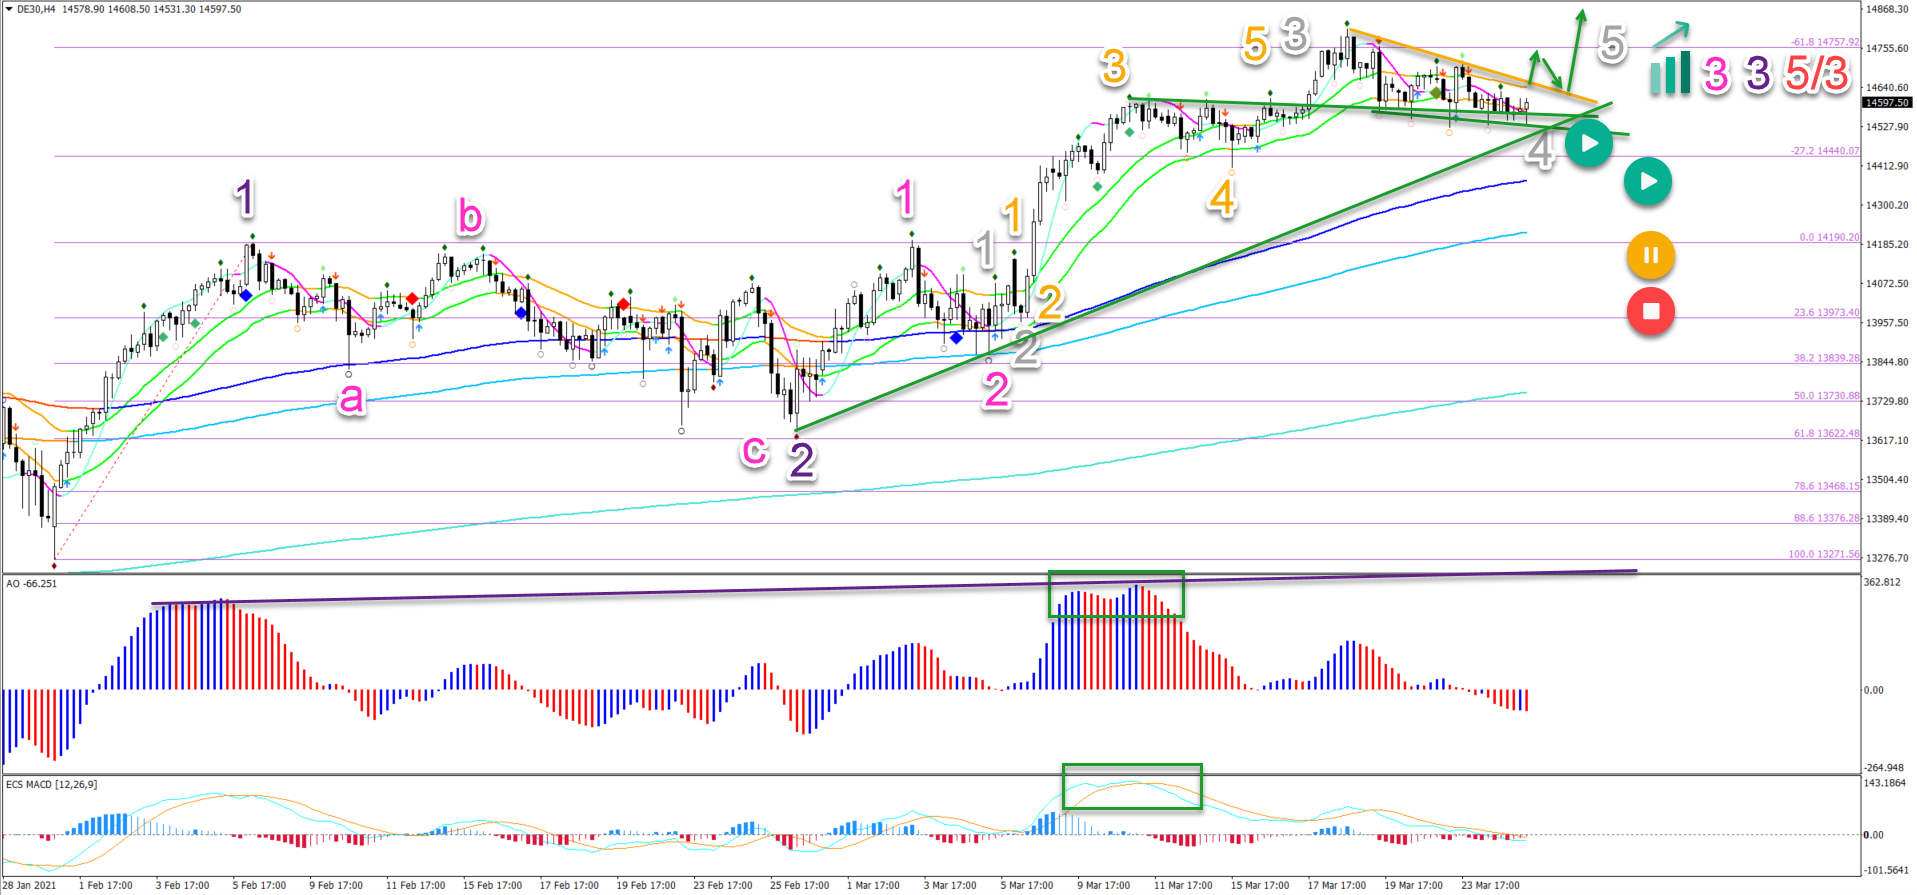
DAX 30 is building a choppy and lengthy sideways correction. The consolidation is typical for a wave 4 pattern (grey). Let’s summarize what to expect:
- The moving averages are bullishly aligned: the 21 ema zone is above the 144 ema close, which is above the 233 and 610 emas.
- Price action is unable to close below the 21 ema low, which is indicating a mild correction in the larger uptrend. This is probably a wave 4 (grey).
- The bearish bounce occurred at the -61.8% Fibonacci target. The next target is the -100 Fib target and round level of 15,000 and 15,100. The second target is at the -161.8% Fibonacci level at 15,700.
- The strong upside is probably a wave 3 (grey). The new high on the oscillators (green boxes) is confirming a strong uptrend. The wave 5 (grey) could complete just a wave 3 (pink) of wave 3 (purple).
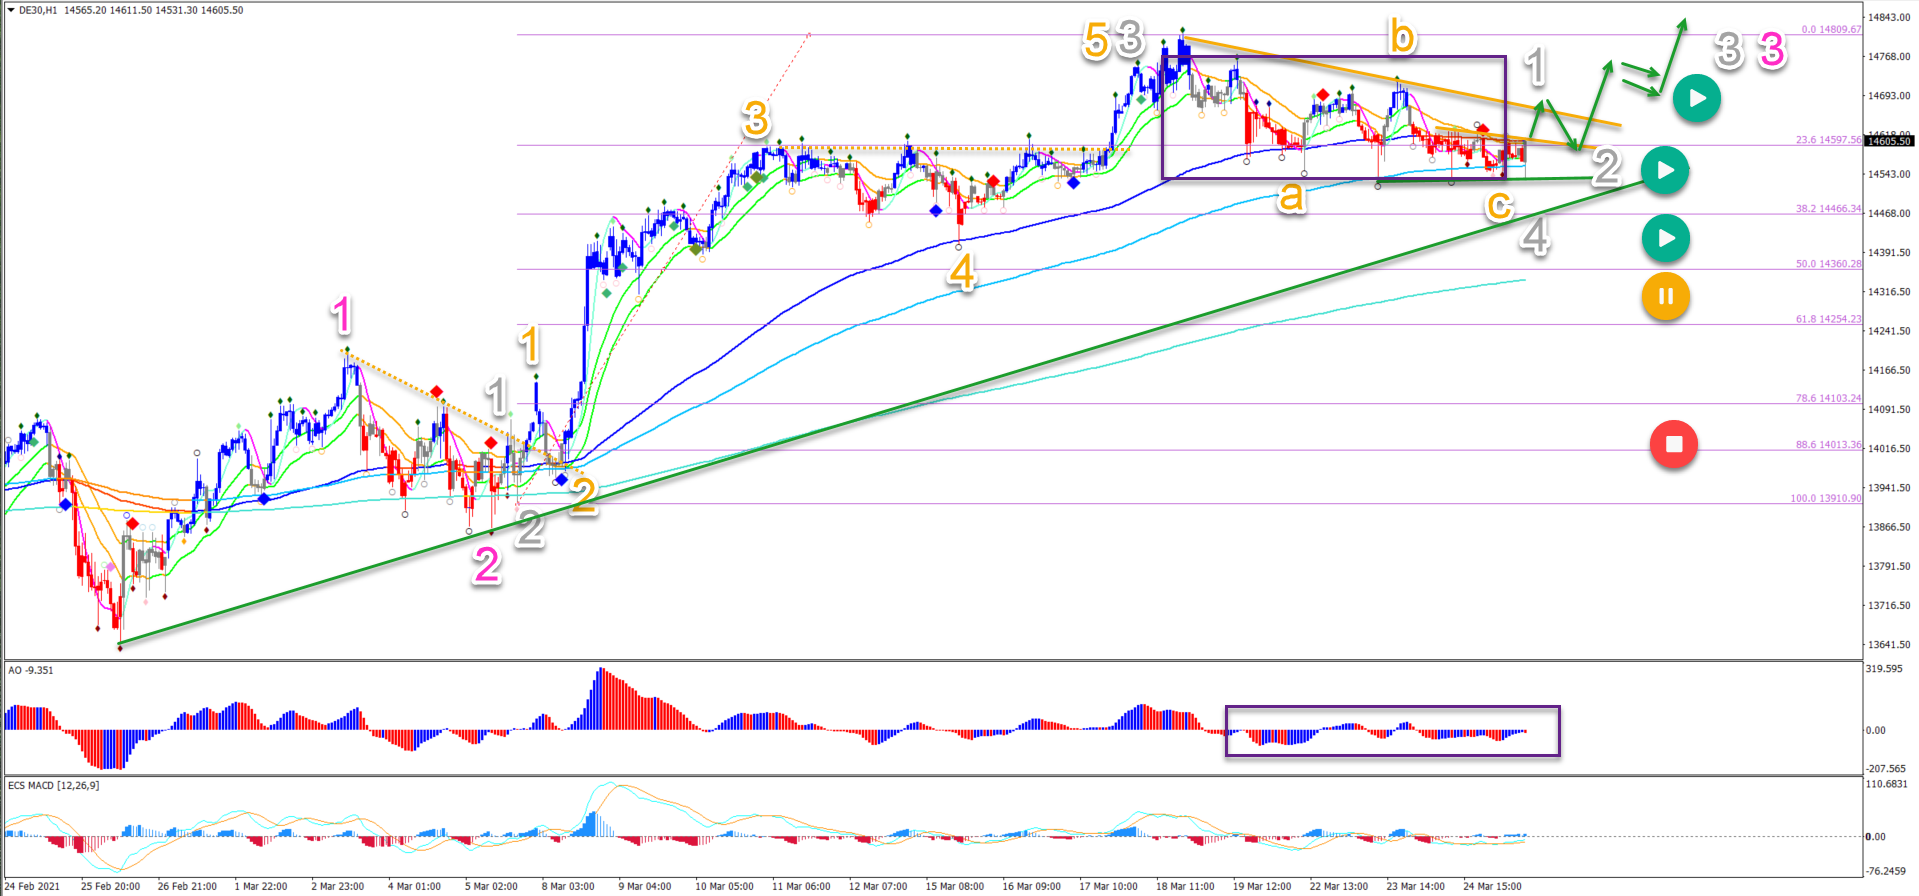
On the 1 hour chart, the consolidation zone is indicated by the purple boxes. Let’s check the 1 hour chart:
- Price action is testing the 144-233 ema zone. A bearish breakout could indicate a deeper retracement towards the 38.2% or even 50% Fib.
- A bullish bounce is expected at the FIbonacci levels unless it breaks the 50% Fib. A break below the 50% places this bullish outlook on hold (yellow circle) or invalidates it (red circle).
- A bullish breakout (green arrows) above the resistance (orange) zone could confirm the continuation of the uptrend via a 5 wave pattern (grey).
Good trading,
Chris Svorcik
The analysis has been done with the indicators and template from the SWAT method (simple wave analysis and trading). For more daily technical and wave analysis and updates, sign-up to our newsletter
For a look at all of today’s economic events, check out our economic calendar.
About the Author
Chris Svorcikcontributor
Chris Svorcik is co-founder, trader, and analyst with Elite CurrenSea (www.EliteCurrenSea.com) since 2014.
Did you find this article useful?
Latest news and analysis


Advertisement