Join Our Telegram channel to stay up to date on breaking news coverage
XRP Price Prediction – April 9
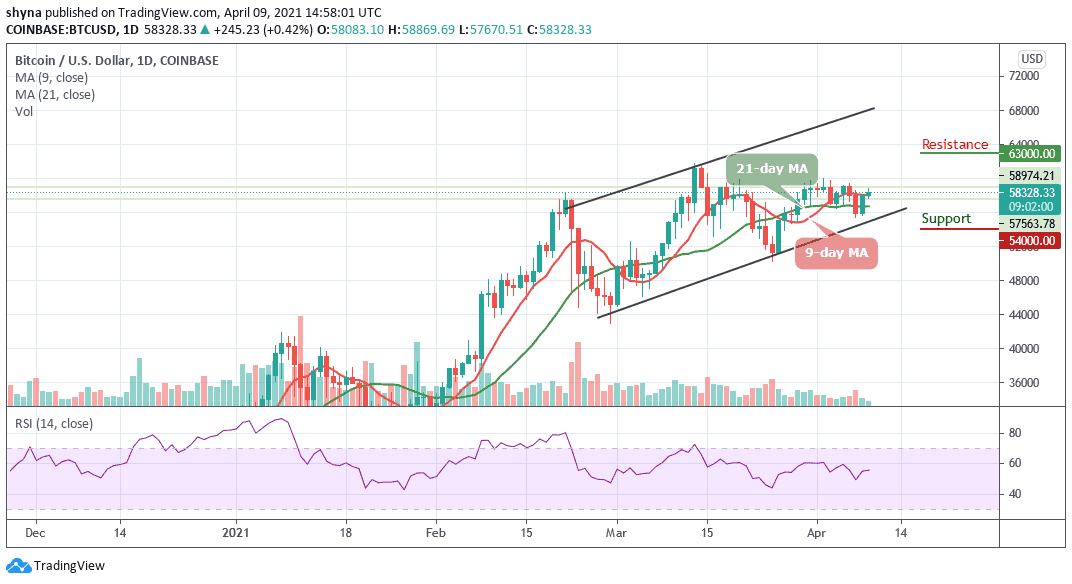
Ripple (XRP) price is facing the south as further downside may likely reach the critical support level at $0.85.
XRP/USD Market
Key Levels:
Resistance levels: $1.20, $1.25, $1.30
Support levels: $0.85, $0.80, $0.75

XRP/USD is seen sliding towards the 9-day and 21-day moving averages as the coin might revisit the $0.90 support before it could start a new increase. After struggling to stay above $1.075, the Ripple begins a slow and steady decline towards the south. As the coin faces the bearish movement, it may target the key support at $0.95 as the price moves into a short-term bearish zone.
What is the Next Direction for Ripple?
At the time of writing, the pair is currently exchanging hands at $1.032 and any attempt to cross below the 9-day moving average may likely open additional doors for more downsides and the price could spike towards the 21-day moving average. Furthermore, we may experience a quick buy once the trade reaches the support at $0.70 and traders should keep eye on the resistance levels of $1.20, $1.25, and $1.30.
However, if the price fails to rebound, then a bearish breakout is likely to trigger more selling opportunities for traders, which might cause the price to retest $0.85 and could further drop to $0.80, and $0.75 support levels respectively. The technical indicator RSI (14) is about leaving the overbought zone and if the signal line moves downward, the coin may fall more.
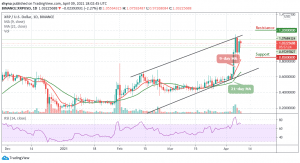
Against Bitcoin, the pair is consolidating within the channel and moving towards the 9-day and 21-day moving averages. Meanwhile, should in case a rebound comes to play, the coin may face the upward trend and the bullish continuation may take it to the resistance levels of 2200 SAT and 2400 SAT respectively.
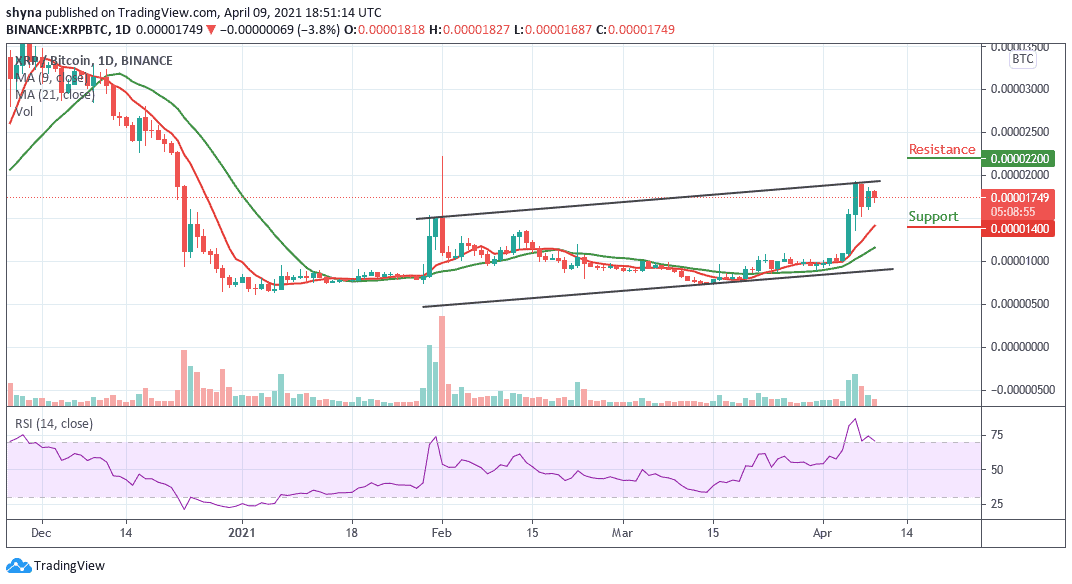
Looking at the daily chart, if the bulls failed to hold the selling pressure, then the pair may likely fall below the channel and the nearest support levels for the coin are 1400 SAT and 1200 SAT. However, the technical indicator RSI (14) is seen moving below 75-level, which indicates a downward movement.
Join Our Telegram channel to stay up to date on breaking news coverage