


Join Our Telegram channel to stay up to date on breaking news coverage
Bitcoin (BTC) Price Prediction – April 11
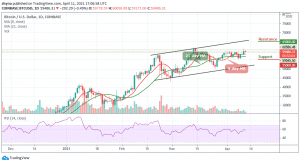
After touching the resistance level of $60,658, BTC/USD retraces and prepares for another move higher.
BTC/USD Long-term Trend: Bullish (Daily Chart)
Key levels:
Resistance Levels: $65,000, $67,000, $69,000
Support Levels: $55,000, $53,000, $51,000
BTC/USD is preparing for another high as the price retraces and touches the daily low of $59,177.06. The resistance level at $60,500 has been a tough resistance line that the coin has not been able to cross. Meanwhile, traders are not surprised by the selling pressure as bears are trying to drag the price below the 9-day and 21-day moving averages. However, until bulls break more upsides, the king coin may likely face a little sideways movement for a while.
What to Expect from Bitcoin (BTC)
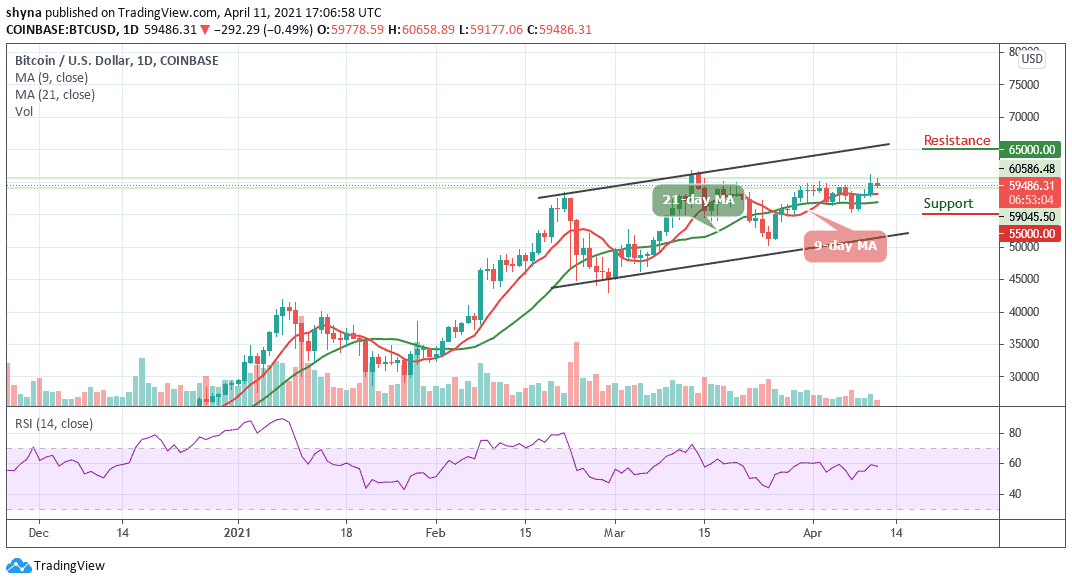
According to the daily chart, the Bitcoin price is moving down with a loss of 0.49% at its current price of $59,486. However, the coming few days may likely shine a light on Bitcoin’s outlook, as it is currently trading at a pivotal point. Therefore, any decline or rise from the current level could determine the trend of the price movement.
Presently, BTC/USD is currently pushing above the moving averages, with bulls moving to erase the losses that came about at the early hour of today’s trading. However, if the coin remains above the moving averages, it may push the price to the resistance level of $65,000, $67,000, and $69,000 while the supports are located below the moving at $55,000, $53,000, and $51,000 as the technical indicator remains below the 60-level.
BTC/USD Medium – Term Trend: Ranging (4H Chart)
According to the 4-hour chart, the resistance at $60,658 has been too heavy for the bulls to overcome as the price is now struggling in a consolidation mode, which has made the cryptocurrency remain indecisive over the past few hours now. The next key resistance level remains at $61,500 and above.
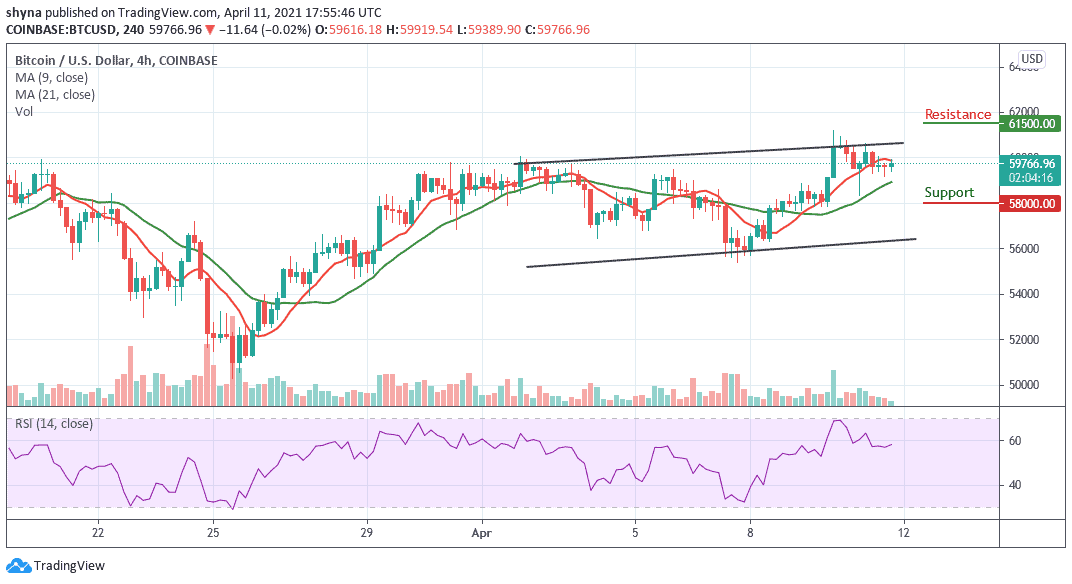
However, the coin is still roaming around $59,766 as bears are pushing the price below the 9-day moving average. Meanwhile, the $58,000 and below may come into play as the technical indicator moves below 60-level.
Join Our Telegram channel to stay up to date on breaking news coverage
