
EUR/CAD Can Be Turning Back To Bullish Mode
Today we will talk about the EURCAD currency pair, its price action from technical point of view, and wave structure from the Elliott Wave perspective.
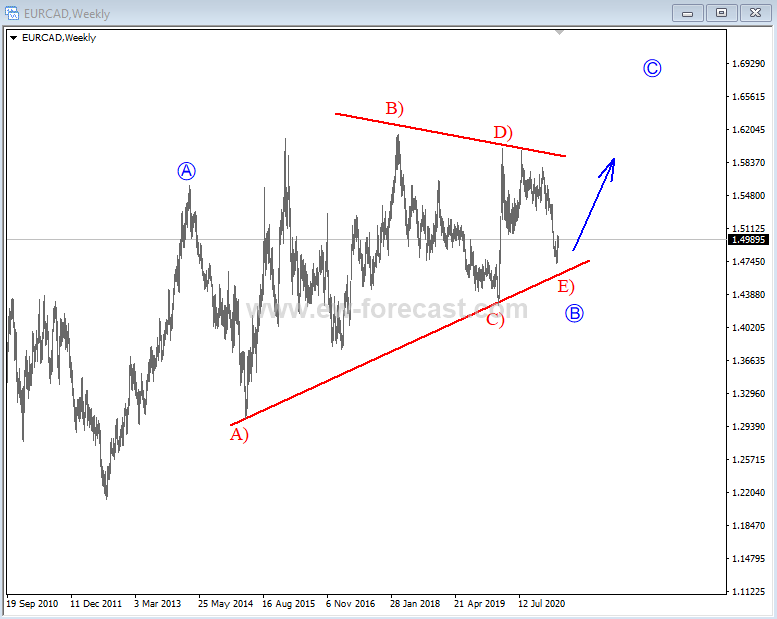
If we take a look at the weekly chart we can see big sideways price action and wave structure which looks to be a big bullish running triangle pattern in wave B. Triangles consist of five waves A)-B)-C)-D)-E) that can be approaching the end as we see it at key lower triangle line support area for the final wave E). If that's the case, then a higher degree wave C back to highs might come in play in upcoming weeks/months.
EURCAD, Weekly
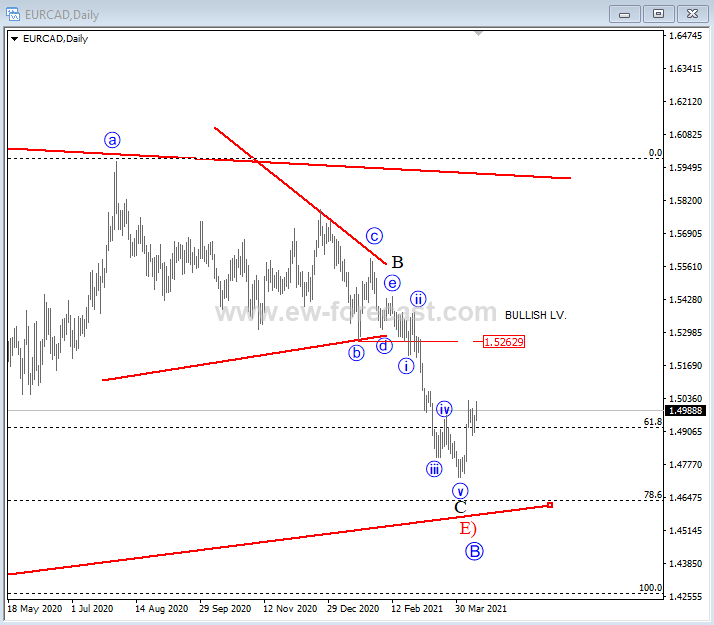
If we take a look at the lower time frame, on a daily chart, we can actually see a three-wave A-B-C corrective decline in that final wave E) of B, where wave C has a clearly completed five-wave cycle, which can be an indication for a completed corrective decline. However, as you can see, bulls could be confirmed only if we see a recovery back above 1.5262 region.
EURCAD, Daily
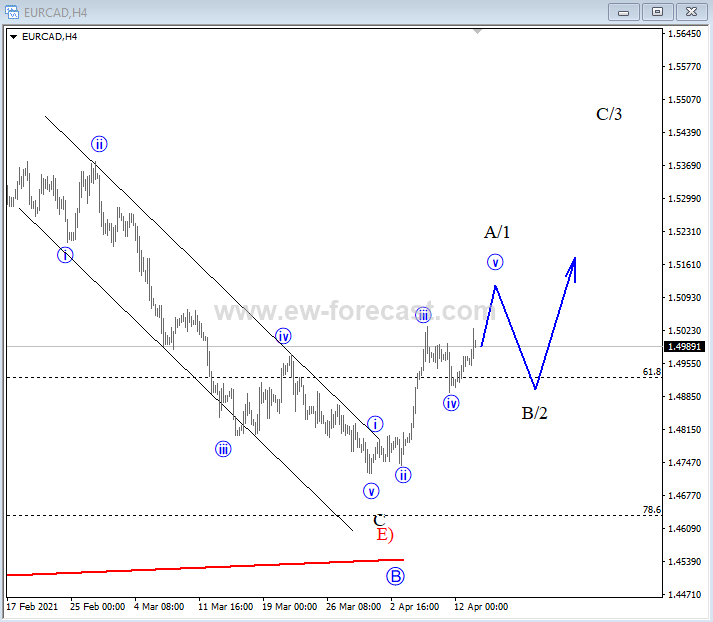
Let's take a closer look. Looking at the 4-hour chart, we can potentially already see it unfolding five waves up from the lows into the first higher degree A/1 leg, which actually indicates for the bottom and bullish reversal that can send the price higher within wave C/3, but before a continuation higher, be aware of a temporary corrective pullback in wave B/2.
EURCAD, 4h
Disclosure: Please be informed that information we provide is NOT a trading recommendation or investment advice. All of our work is for educational purposes only.


