
Advertisement
Advertisement
EOS, Stellar’s Lumen, and Tron’s TRX – Daily Analysis – April 15th, 2021
By:
It's a bearish start to the day for the majors. Failure to move back through the day's pivot levels would leave support levels in play.

In this article:
EOS
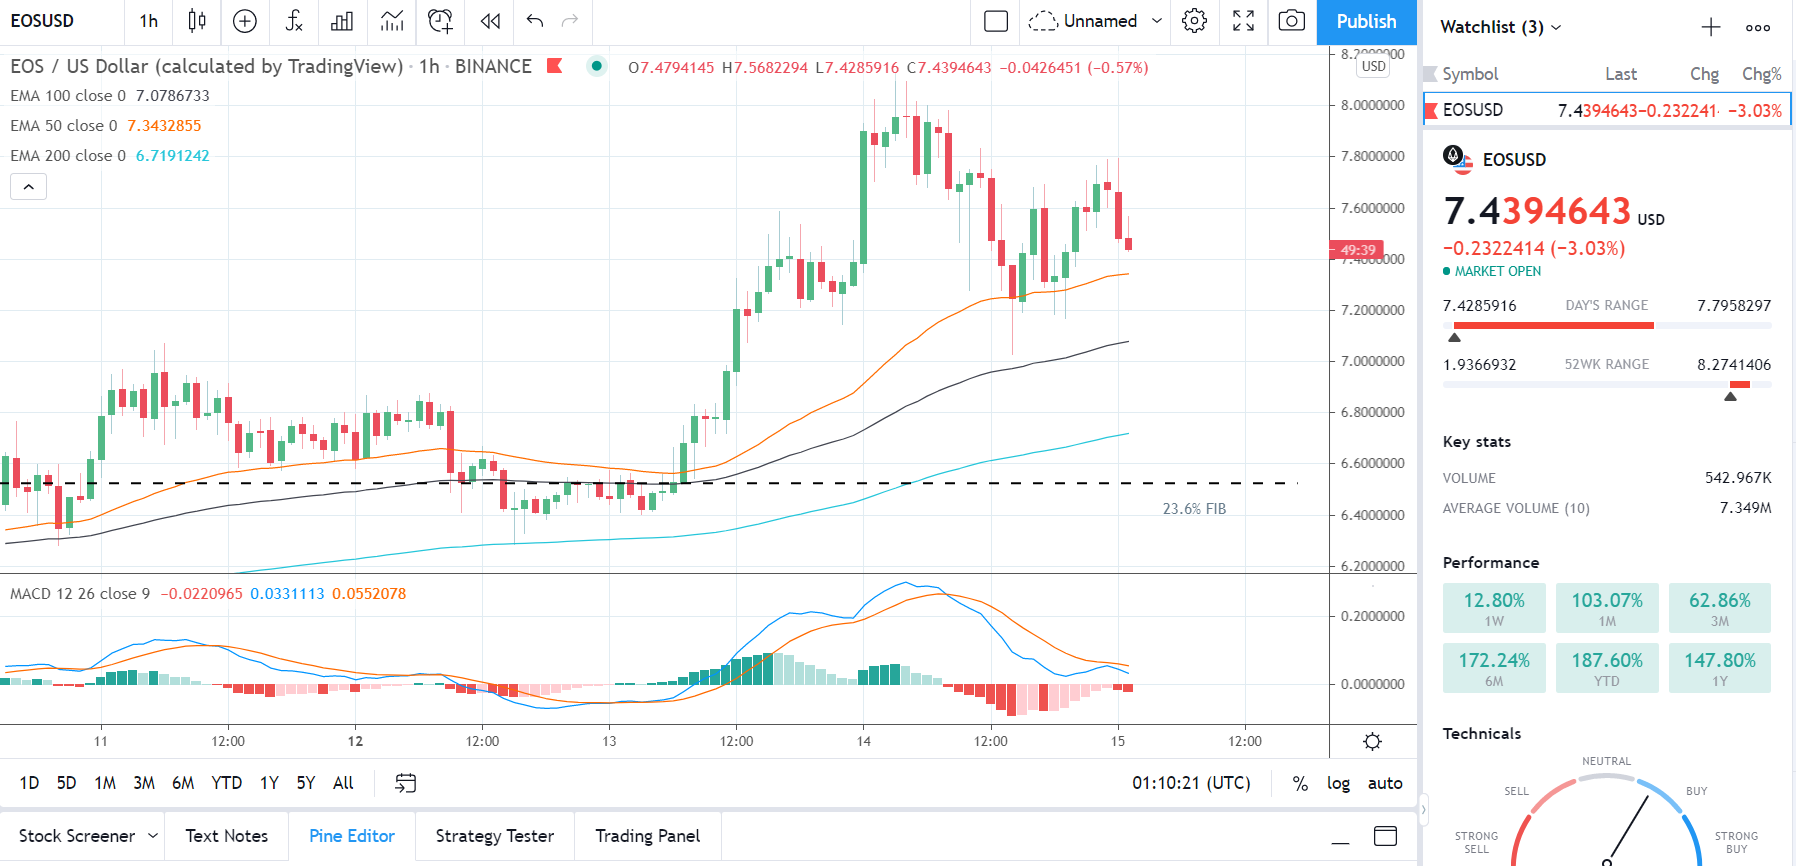
EOS rose by 3.89% on Wednesday. Following on from a 14.26% rally on Tuesday, EOS ended the day at $7.6717.
A bullish start to the day saw EOS rise to an early morning intraday high $8.1288 before hitting reverse.
EOS broke through the first major resistance level at $7.8193 before sliding to an early afternoon intraday low $7.0261.
Steering clear of the first major support level at $6.7223, EOS moved back through to $7.78 levels to deliver the upside on the day.
At the time of writing, EOS was down by 3.03% to $7.4395. A mixed start to the day saw EOS rise to an early morning high $7.9858 before falling to a low $7.4286.
EOS left the major support and resistance levels untested early on.
For the day ahead
EOS would need to move back through the $7.6089 pivot level to support another run at the first major resistance level at $8.1916.
Support from the broader market would be needed, however, for EOS to break out from Wednesday’s high $8.1288.
Barring an extended crypto rally, the first major resistance level and resistance at $8.20 would likely cap any upside.
In the event of an extended rally, EOS could test resistance at $9.00 before any pullback. The second major resistance level sits at $8.7116.
Failure to move back through the $7.6089 pivot would bring the first major support level at $7.0889 into play.
Barring another extended sell-off, however, EOS should steer clear of the 23.6% FIB of $6.5200. The second major support level sits at $6.5062.
Looking at the Technical Indicators
First Major Support Level: $7.0889
First Major resistance Level: $8.1916
23.6% FIB Retracement Level: $6.52
38% FIB Retracement Level: $9.68
62% FIB Retracement Level: $14.77
Stellar’s Lumen
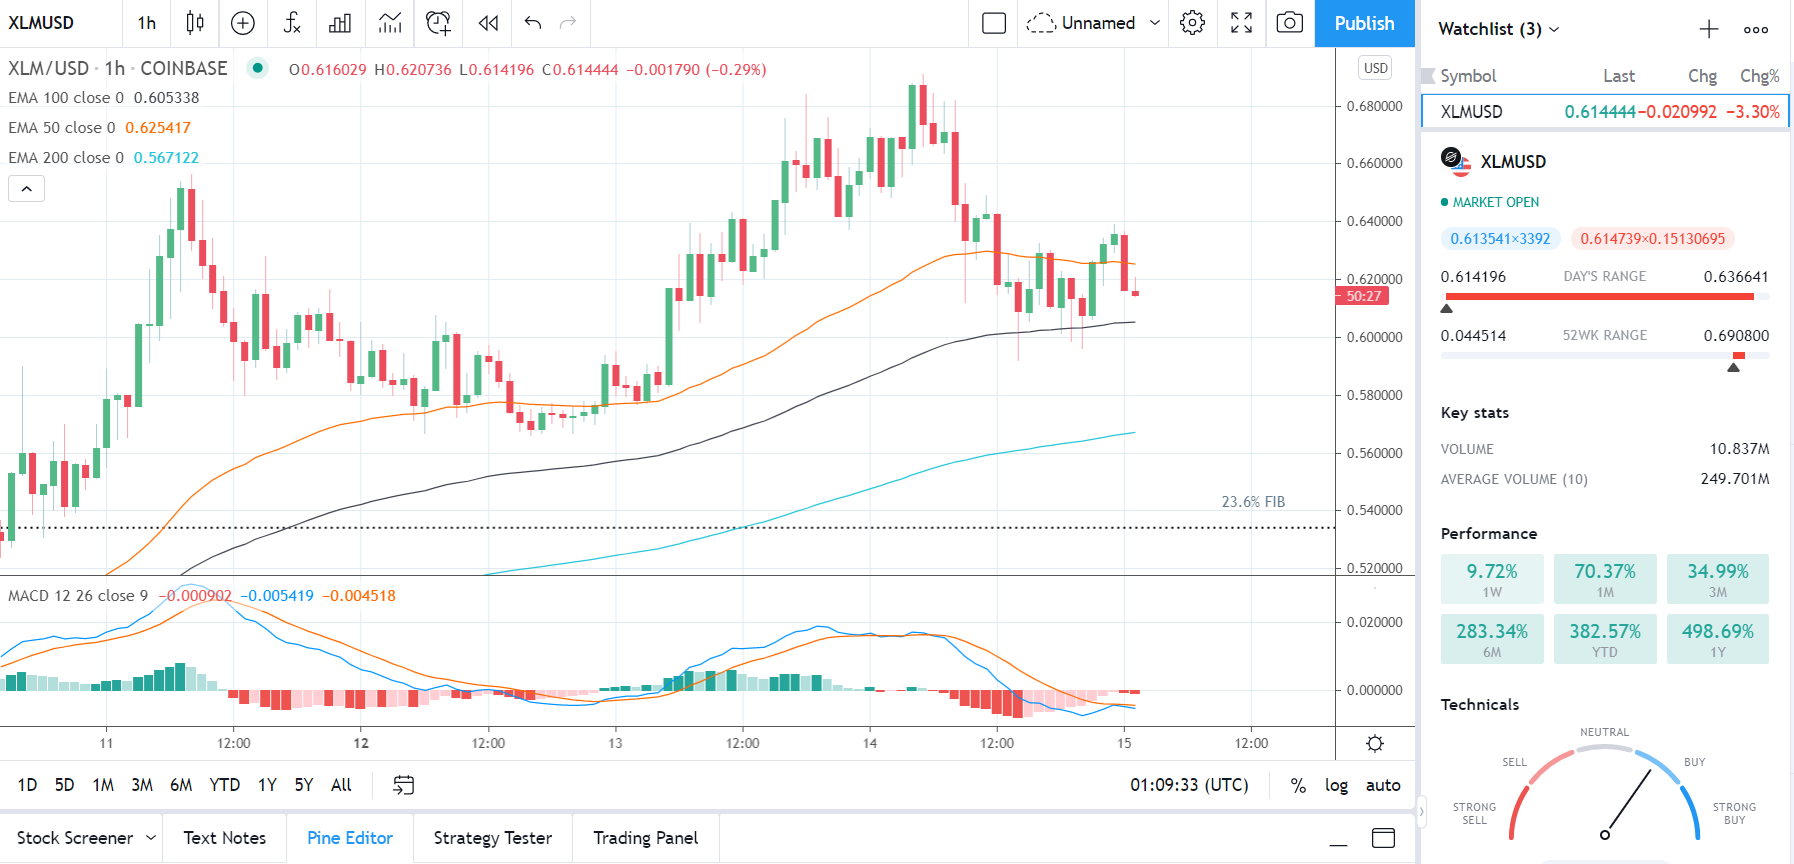
Stellar’s Lumen fell by 3.35% on Wednesday. Partially reversing an 11.35% rally from Tuesday, Stellar’s Lumen ended the day at $0.6354.
A bullish start to the day saw Stellar’s Lumen rally to an early morning intraday high and a new swing hi $0.6908 before hitting reverse.
Falling short of the first major resistance level at $0.7020, Stellar’s Lumen slid to an early afternoon intraday low $0.5921.
Stellar’s Lumen fell through the first major support level at $0.5947 before a partial recovery to $0.63 levels.
At the time of writing, Stellar’s Lumen was down by 3.30% to $0.6144. A mixed start to the day saw Stellar’s Lumen rise to an early morning high $0.6366 before falling to a low $0.6142.
Stellar’s Lumen left the major support and resistance levels untested early on.
For the day ahead
Stellar’s Lumen would need to move back through the pivot level at $0.6394 to bring the first major resistance level at $0.6868 into play.
Support from the broader market would be needed, however, for Stellar’s Lumen break out from $0.65 levels.
Barring an extended crypto rally, the first major resistance level and Wednesday’s swing hi $0.6908 would likely cap any upside.
In the event of an extended rally, Stellar’s Lumen could test resistance at $0.70. The second major resistance level sits at $0.7381.
Failure to move back through the $0.6394 pivot would bring the first major support level at $0.5881 into play.
Barring an extended sell-off on the day, Stellar’s Lumen should steer clear of the second major support level at $0.5407.
Looking at the Technical Indicators
First Major Support Level: $0.5881
First Major Resistance Level: $0.6868
23.6% FIB Retracement Level: $0.5342
38% FIB Retracement Level: $0.4373
62% FIB Retracement Level: $0.2808
Tron’s TRX
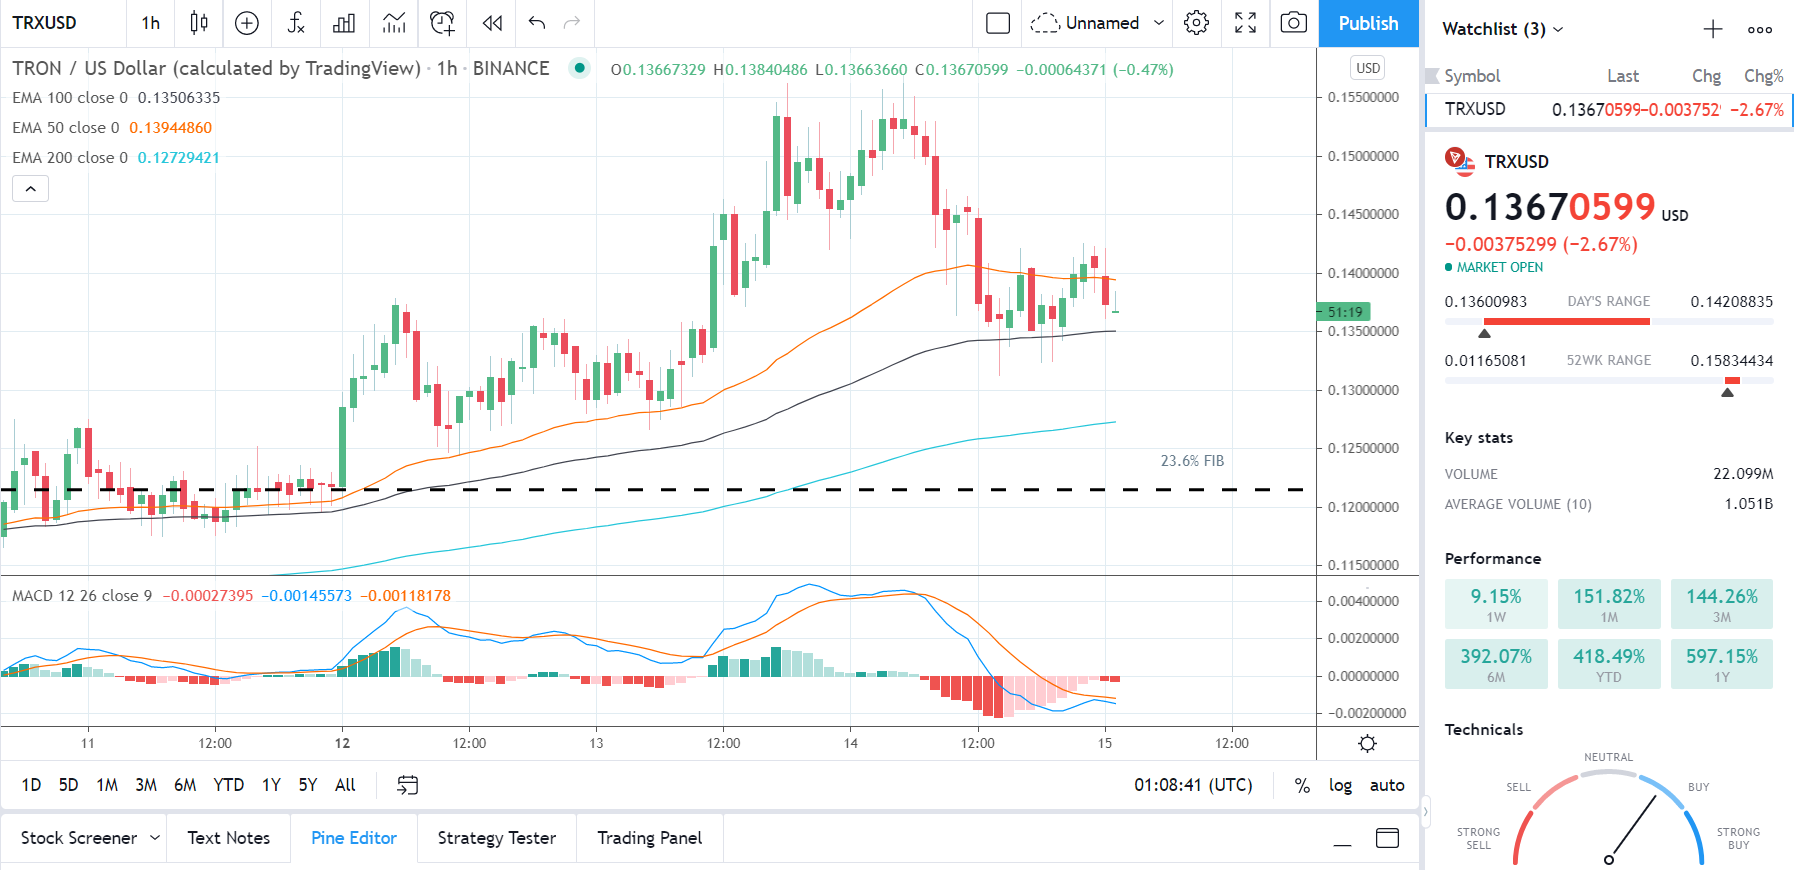
Tron’s TRX fell by 3.96% on Wednesday. Partially reversing a 13.16% rally from Tuesday, Tron’s TRX ended the day at $0.1405.
A bullish start to the day saw Tron’s TRX rise to an early morning intraday high and a new swing hi $0.1570 before hitting reverse.
Falling short of the first major resistance level at $0.1594, Tron’s TRX slid to an early afternoon intraday low $0.1313.
Steering clear of the first major support level at $0.1299, Tron’s TRX revisited $0.1425 levels before easing back.
At the time of writing, Tron’s TRX was down by 2.67% to $0.1367. A mixed start to the day saw Tron’s TRX rise to an early morning high $0.1421 before falling to a low $0.1360.
Tron’s TRX left the major support and resistance levels untested early on.
For the Day Ahead
Tron’s TRX would need to move back through the $0.1429 pivot to bring the first major resistance level at $0.1546 into play.
Support from the broader market would be needed, however, for Tron’s TRX to break back through to $0.15 levels.
Barring an extended crypto rally, the first major resistance level and Wednesday’s new swing hi $0.1570 would likely cap any upside.
In the event of an extended rally Tron’s TRX could test resistance at $0.165 before any pullback. The second major resistance level sits at $0.1686.
Failure to move back through the $0.1429 pivot would bring the first major support level at $0.1289 into play.
Barring an extended sell-off, Tron’s TRX should steer clear of the second major support level at $0.1172. The 23.6% FIB of $0.1216 should limit the downside.
Looking at the Technical Indicators
First Major Support Level: $0.1289
First Major Resistance Level: $0.1546
23.6% FIB Retracement Level: $0.1216
38.2% FIB Retracement Level: $0.0997
62% FIB Retracement Level: $0.0644
Please let us know what you think in the comments below
Thanks, Bob
About the Author
Bob Masonauthor
With over 20 years of experience in the finance industry, Bob has been managing regional teams across Europe and Asia and focusing on analytics across both corporate and financial institutions. Currently he is covering developments relating to the financial markets, including currencies, commodities, alternative asset classes, and global equities.
Did you find this article useful?
Latest news and analysis


Advertisement