
Advertisement
Advertisement
DAX 30 Waiting for Pullback to 38.2% and 144 ema at 15k
By:
German stock index DAX 30 has been in a major uptrend since the bullish reversal from March 2020. The uptrend remains valid but a bearish pullback is likely.

In this article:
The German stock index DAX 30 (DE30) has been in a major uptrend since the bullish reversal from March 2020. The uptrend remains valid but a bearish pullback is becoming likely.
This article reviews what to expect from the retracement and when the uptrend should resume. Let’s start.
Price Charts and Technical Analysis
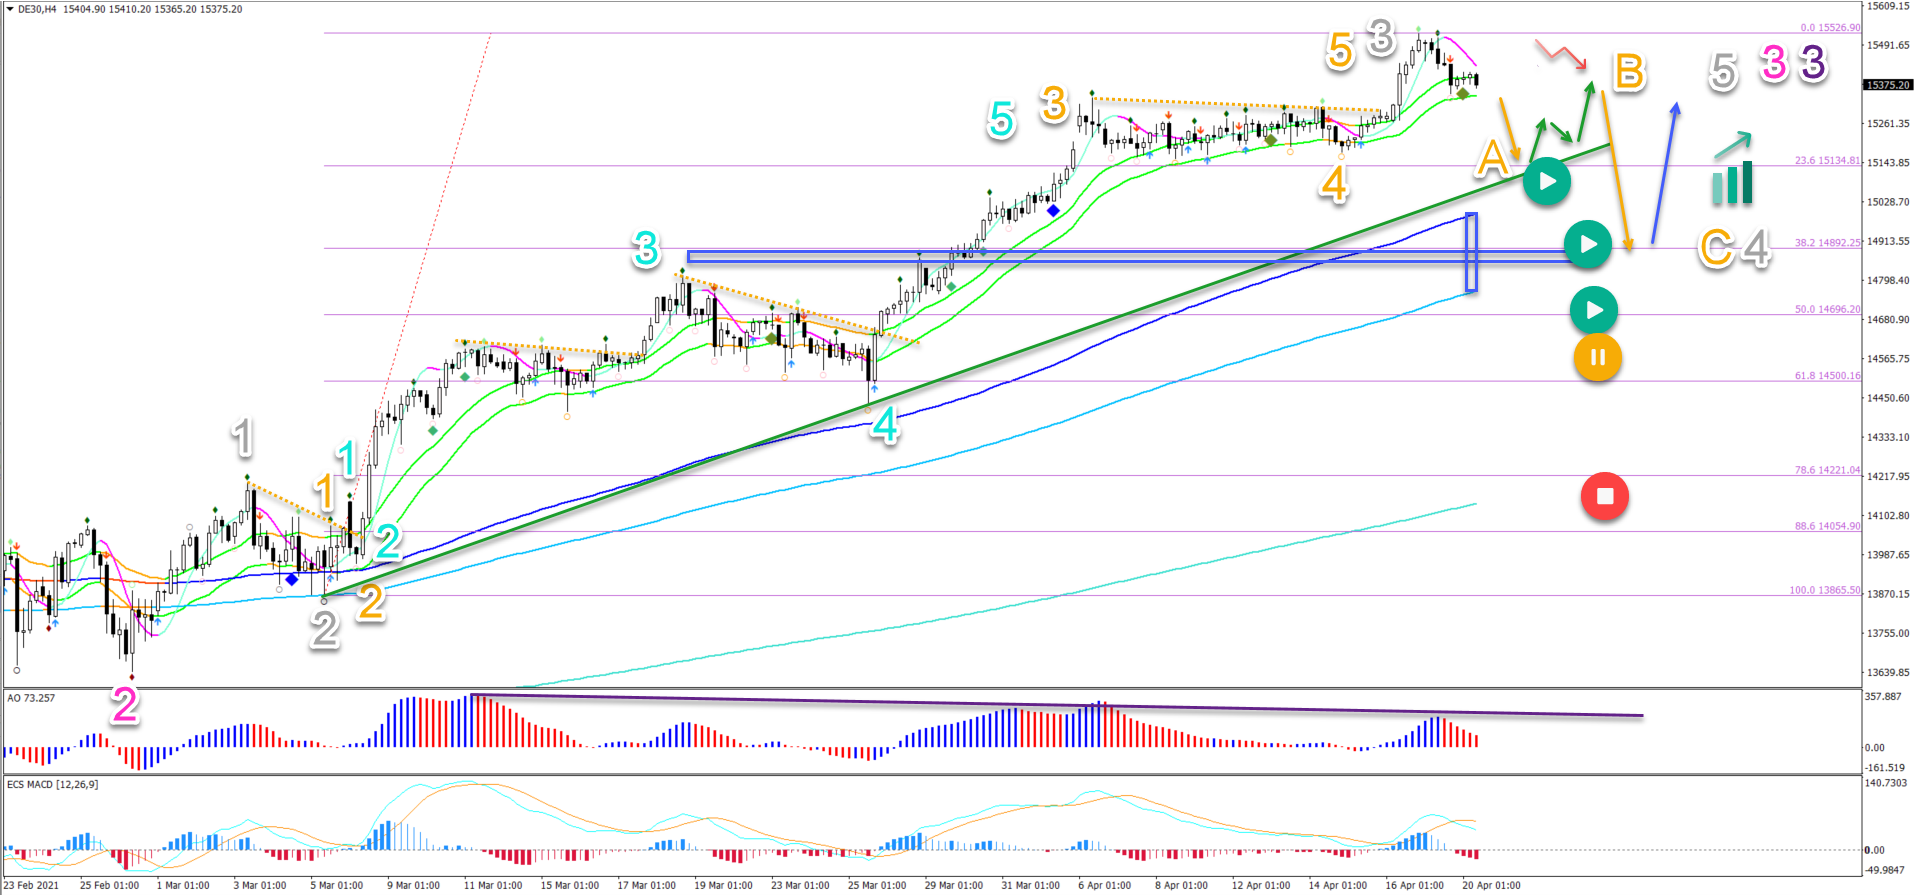
The DAX 30 chart is showing a clear uptrend on the 4 hour, besides the strong daily uptrend as well. The price action is above the 21 ema zone, which is above the long-term moving averages such as the 144, 233, and 610 ema close:
- A divergence pattern, however, is visible between the tops (purple line on AO). The double divergence usually indicates a higher chance of a bearish retracement.
- The usual target of the divergence pattern is around the 144 ema close.
- In this case, price action might push a little bit lower and make a decline towards the 38.2% Fibonacci retracement level of wave 3 (grey).
- The current wave patterns suggest a wave 3 (grey) of waves 3 (pink/purple). The pullback therefore could be a potential wave 4 (grey).
- A bearish breakout below the 21 ema zone could confirm the bearish wave A (orange) of wave 4 (grey).
- A bullish bounce and ABC pattern at the 23.6% Fib could indicate a wave B (orange) followed by another price swing lower towards the 38.2% Fib and 144 ema within wave C (grey).
- This wave analysis remains valid as long as price action stays above the 50% Fib. A break below the 50% places it on hold (yellow) and deeper retracement invalidates (red).
- A strong bullish bounce (blue arrow) indicates the end of the bearish correction and the potential restart of the uptrend.
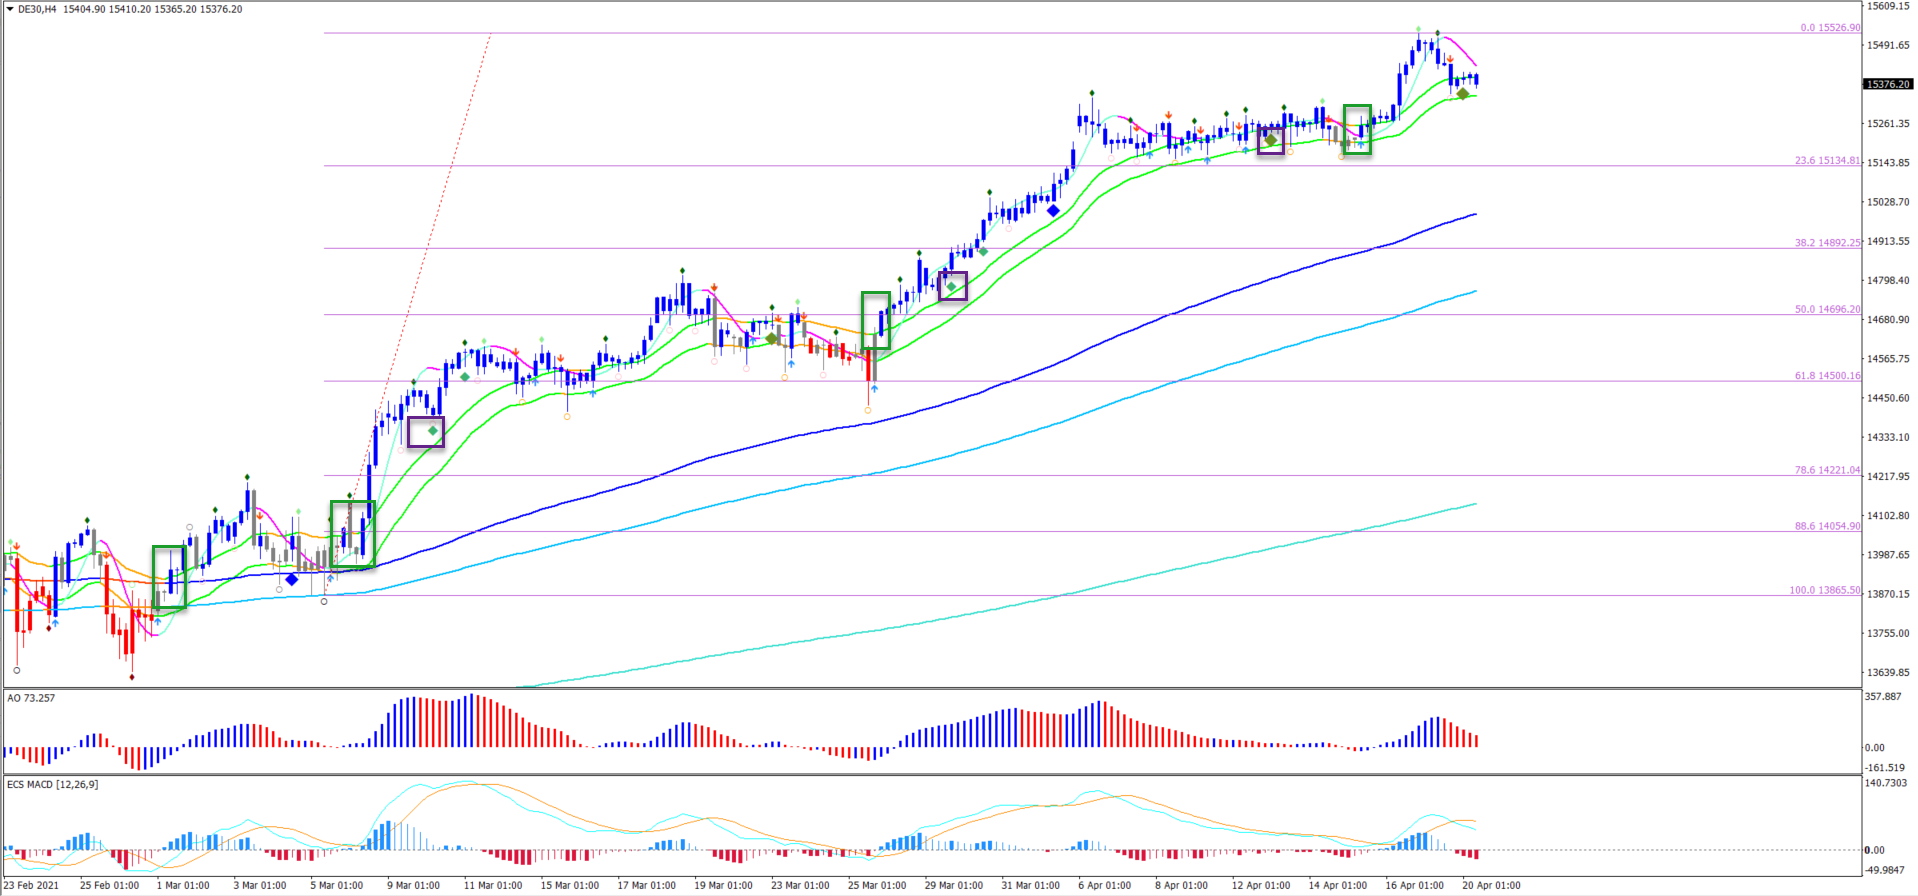
On the 4 hour chart below, we can see how the moving averages help us identify the moments when price action is making a pullback within the uptrend.
- The breakouts (green box) above the 21 ema zone signals a continuation of the trend. This is certainly valid when all the moving averages are aligned to one direction. In this case, all of them are pointed upward.
- The bullish push away from the 21 ema zone indicates strong momentum (purple boxes). This happens when price action does not hit the 21 ema high or low.
- But with a divergence pattern visible, the 21 ema is not expected to offer strong support anymore in this uptrend. And usually, there is a retracement that goes to the 144 ema.
- A break below the 21 ema zone could indicate the end of the immediate uptrend and a push to the 144 ema.
- A bullish bounce is expected to take place around the 144 ema because of the strong uptrend.
Good trading,
Chris Svorcik
The analysis has been done with the indicators and template from the SWAT method (simple wave analysis and trading). For more daily technical and wave analysis and updates, sign-up to our newsletter
For a look at all of today’s economic events, check out our economic calendar.
About the Author
Chris Svorcikcontributor
Chris Svorcik is co-founder, trader, and analyst with Elite CurrenSea (www.EliteCurrenSea.com) since 2014.
Did you find this article useful?
Latest news and analysis


Advertisement