
Advertisement
Advertisement
Natural Gas Price Futures (NG) Technical Analysis – Closed on Strong Side of $2.868 to $2.802 Retracement Zone
By:
The direction of the June natural gas market on Wednesday is likely to be determined by trader reaction to $2.942.

In this article:
A huge drop in U.S. production spiked natural gas futures higher on Tuesday as traders shrugged off a modest pullback in exports and continued forecasts calling for moderate temperatures in May. The price surge was fueled by pipeline maintenance which led to a pronounced decrease in production. With the May futures contract set to come off the board on Wednesday, traders may be bracing for another day of excessive volatility.
At 03:02 GMT, June natural gas futures are trading $2.936, down $0.006 or -0.20%.
Daily Swing Chart Technical Analysis
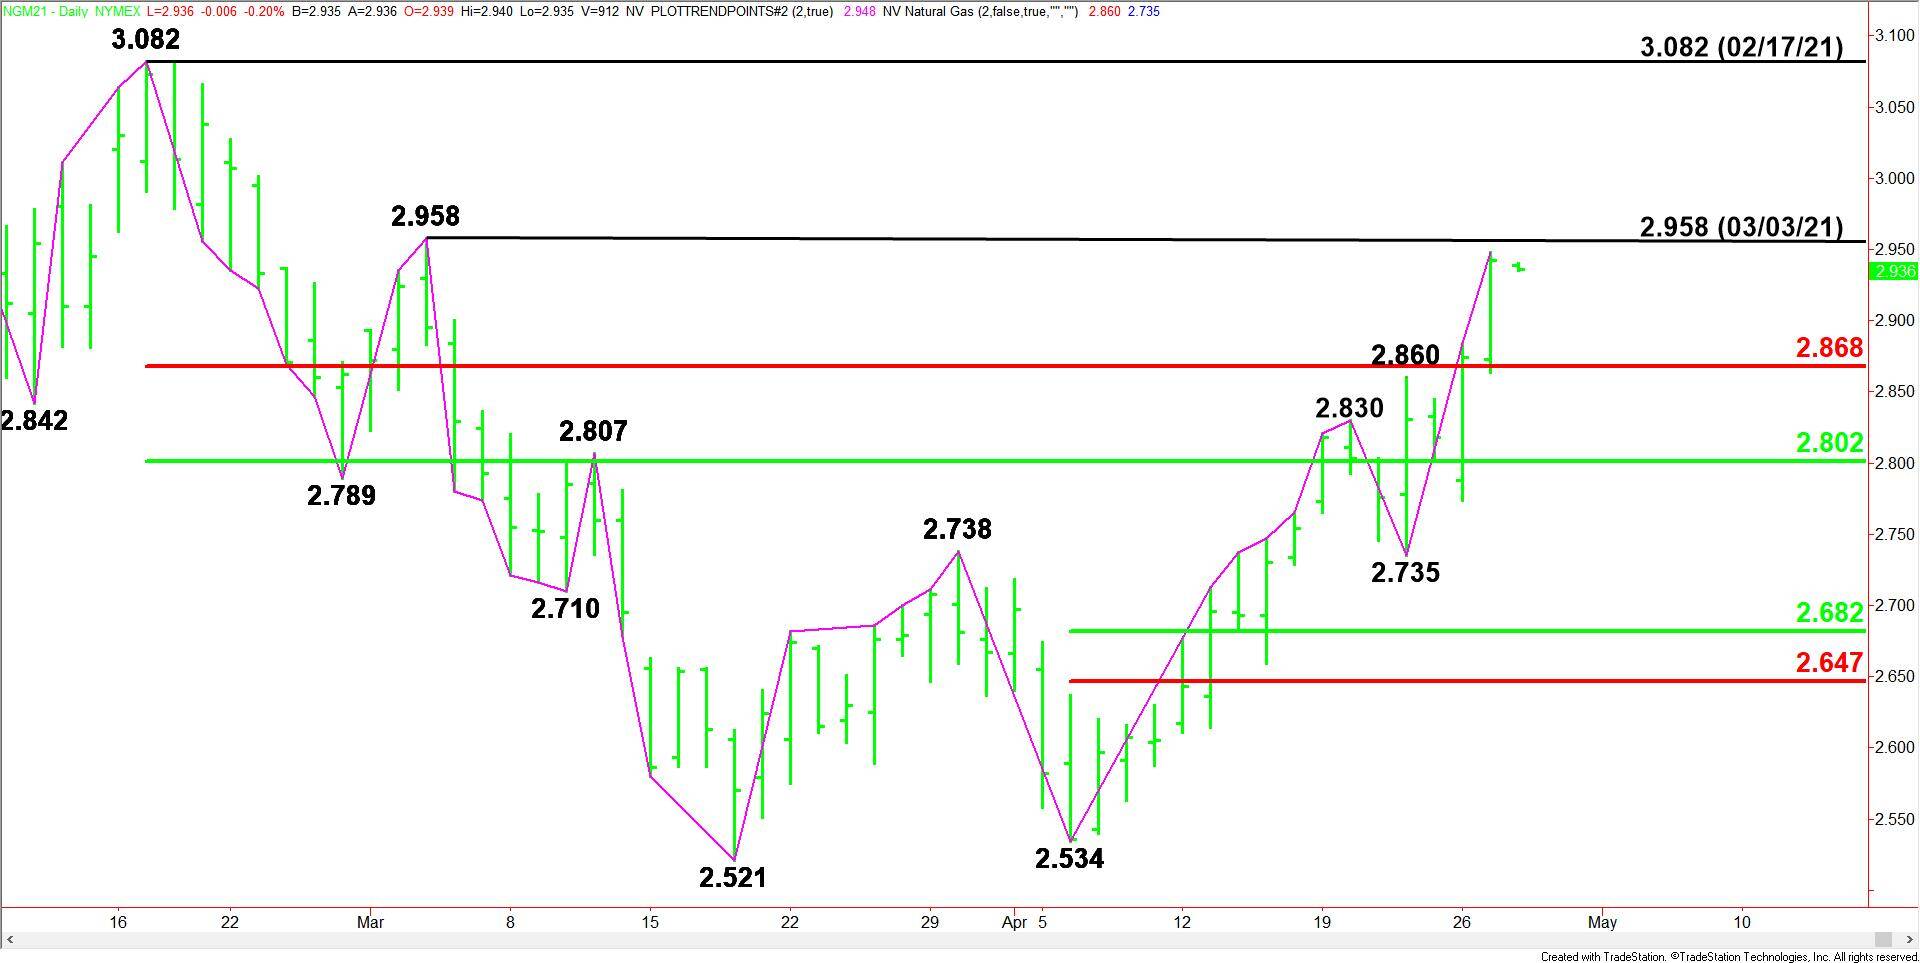
The main trend is up according to the daily swing chart. A trade through the March 3 main top at $2.958 will reaffirm the uptrend. A trade through $2.735 will change the main trend to down.
The main range is $3.082 to $2.521. The market is currently trading on the strong side of its retracement zone at $2.868, making it support.
Daily Swing Chart Technical Forecast
The direction of the June natural gas market on Wednesday is likely to be determined by trader reaction to $2.942.
Bullish Scenario
A sustained move over $2.942 will indicate the presence of buyers. The first two upside targets are $2.948 and $2.958.
Taking out $2.958 will not only reaffirm the uptrend, but it could trigger an acceleration to the upside. The daily chart indicates there is plenty of room to the upside with the February 17 main top at $3.082 the next major upside target.
Bearish Scenario
A sustained move under $2.942 will signal the presence of sellers, or the lack of buyers. This won’t signal a change in the minor or a major trends, but it may be an indication that the selling is greater than the buying at current price levels.
If a trade under $2.958 creates enough downside momentum then look for a possible pullback into the main Fibonacci level at $2.868. Since the main trend is up, buyers are likely to come in on a test of this level.
Side Notes
Taking out $2.948 then closing lower for the session will form a potentially bearish closing price reversal top. If confirmed, this could trigger the start of a 2 to 3 day correction.
For a look at all of today’s economic events, check out our economic calendar.
About the Author
James Hyerczykauthor
James is a Florida-based technical analyst, market researcher, educator and trader with 35+ years of experience. He is an expert in the area of patterns, price and time analysis as it applies to futures, Forex, and stocks.
Did you find this article useful?
Latest news and analysis


Advertisement