Join Our Telegram channel to stay up to date on breaking news coverage
LTC Price Prediction – May 3
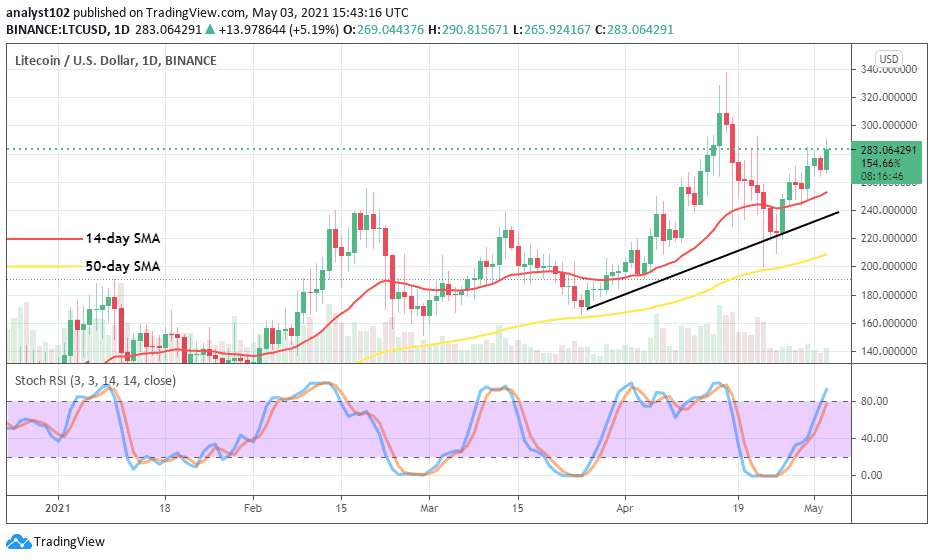
The Litecoin price is currently changing hands at $288 as the RSI (14) indicator swings above 60-level.
LTC/USD Market
Key Levels:
Resistance levels: $320, $340, $360
Support levels: $220, $200, $180
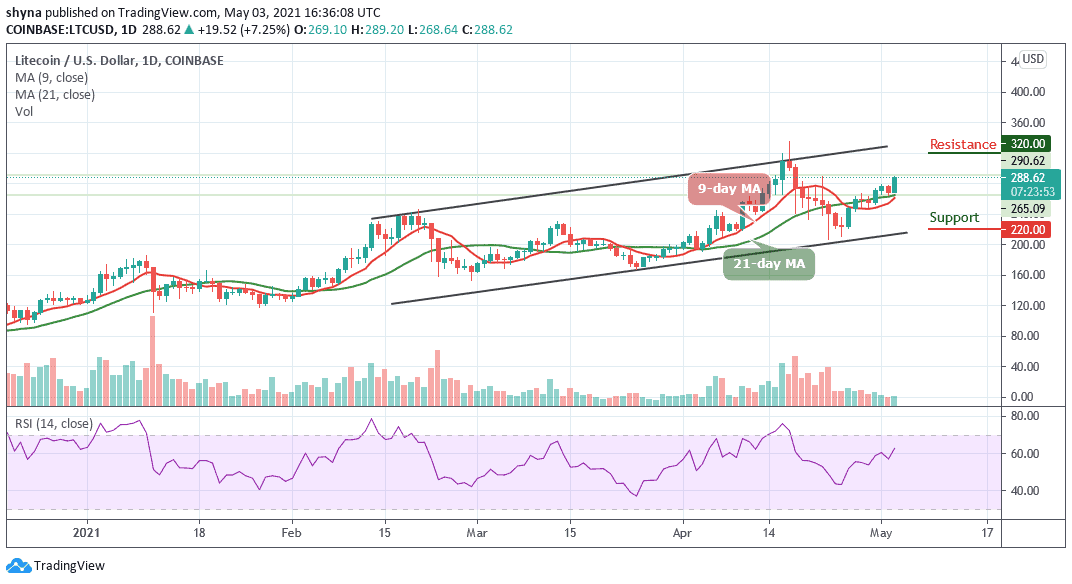
LTC/USD is still keeping the upward movement as its price moves toward the upper boundary of the channel with a gain of over 7.20%. At the time of writing, the Litecoin (LTC) bulls breaks above the 9-day and 21-day moving averages and capped to the upside at $289, and supported the downside at $268, within tight conditions.
What to Expect from Litecoin (LTC)
Yesterday, the Litecoin (LTC) price was trapped in a slight downward trend after the bullish rally failed to materialize above the $277 level. The coin has failed to clear the hurdles towards the resistance level of $280 but today, the bulls are back into the market as they keep the coin above the moving averages. More so, a break above the $300 resistance level may provoke a bull-run towards the resistance levels of $320, $340, and $360 respectively.
Furthermore, the daily chart reveals that LTC/USD may exhibit the tendencies to move higher as the technical indicator crosses above the 60-level. Nevertheless, if the buyers failed to push the market towards the upper boundary of the channel, the market price may slump below the moving averages to reach the support levels of $220, $200, and $180.
Against Bitcoin, Litecoin price is making an attempt to cross the channel in other to reach the resistance at 0.0053 BTC. Unless this coin crossed above the trend line and the price ends up closing above it, there might not be any reason to expect the bullish reversal.
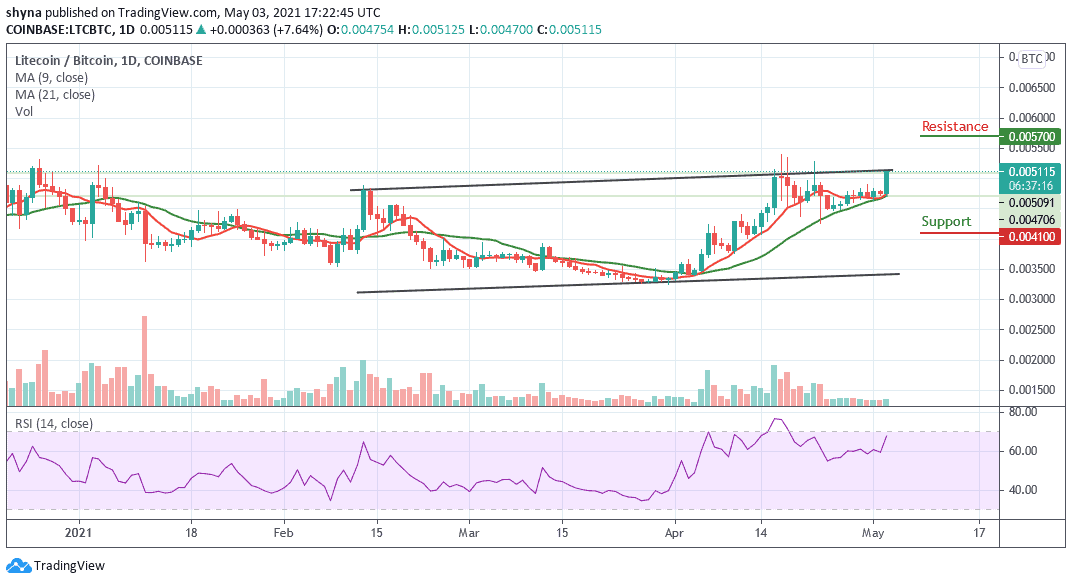
However, any movement below the nearest support could refresh lows below the moving averages and a possible bearish continuation may likely meet the major support at 0.0043 BTC before falling to 0.0041 BTC and below while the buyers may push the market above the channel to hit the resistance at 0.0057 BTC and above. Meanwhile, the RSI (14) prepares to move into the overbought zone to increase the bullish movement.
Read more:
- Bitcoin Price Prediction: BTC/USD Fails to Break out; Price Trades below $48,000
- Ethereum Price Prediction: ETH/USD Slides Below $240 After Rejection at $243
Join Our Telegram channel to stay up to date on breaking news coverage