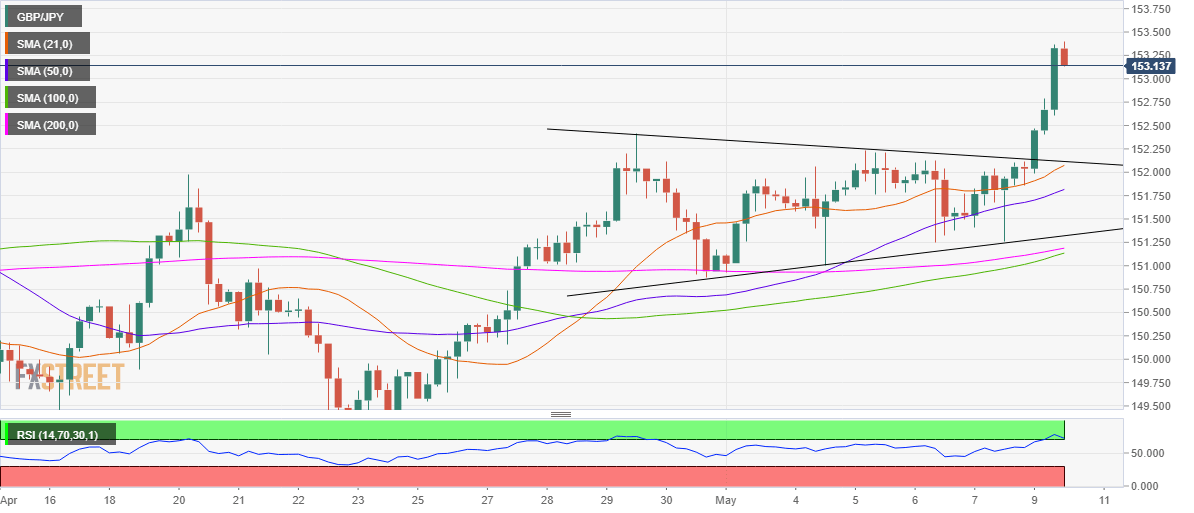
- GBP/JPY sits at three-year highs above 153.00 after UK local elections.
- Symmetrical triangle breakout on the 4H chart targets 153.65.
- Overbought RSI conditions remain a cause for concern.
GBP/JPY is holding at the highest levels in three years at 153.40, having rallied nearly 140 pips from the daily lows of 151.98.
The surge in the cross is mainly driven by strong gains in the pound, as the bulls cheer the outcome of the local elections in the UK. Prime Minister Boris Johnson’s Conservative Party came in stronger than expected in Northern England.
Meanwhile, the Scottish National Party (SNP) fell short of an outright majority, which implies the second independence referendum could be at risk.
Further, the UK prepares to extend its covid reopening, which also serves positive for the cross. Additionally, mild gains in USD/JPY fail to have little to no impact on the cross.
From a near-term technical perspective, GBP/JPY remains poised to break above the 153.50 barrier, following a symmetrical triangle breakout on the four-hour chart confirmed late Friday.
The 14-day Relative Strength Index (RSI) has eased slightly but remains within the overbought territory, signaling caution for the bulls.
The intraday low of 151.98 could offer strong support if the correction gathers traction. Ahead of that the 152.50 psychological level needs to cave in.
On the flip side, acceptance above 153.50 could call for a test of the pattern target measured at 153.66.
Further up, the 154 round figure could come into play.
GBP/JPY four-hour chart
GBP/JPY additional levels to watch
Information on these pages contains forward-looking statements that involve risks and uncertainties. Markets and instruments profiled on this page are for informational purposes only and should not in any way come across as a recommendation to buy or sell in these assets. You should do your own thorough research before making any investment decisions. FXStreet does not in any way guarantee that this information is free from mistakes, errors, or material misstatements. It also does not guarantee that this information is of a timely nature. Investing in Open Markets involves a great deal of risk, including the loss of all or a portion of your investment, as well as emotional distress. All risks, losses and costs associated with investing, including total loss of principal, are your responsibility. The views and opinions expressed in this article are those of the authors and do not necessarily reflect the official policy or position of FXStreet nor its advertisers. The author will not be held responsible for information that is found at the end of links posted on this page.
If not otherwise explicitly mentioned in the body of the article, at the time of writing, the author has no position in any stock mentioned in this article and no business relationship with any company mentioned. The author has not received compensation for writing this article, other than from FXStreet.
FXStreet and the author do not provide personalized recommendations. The author makes no representations as to the accuracy, completeness, or suitability of this information. FXStreet and the author will not be liable for any errors, omissions or any losses, injuries or damages arising from this information and its display or use. Errors and omissions excepted.
The author and FXStreet are not registered investment advisors and nothing in this article is intended to be investment advice.
Recommended content
Editors’ Picks
EUR/USD clings to daily gains above 1.0650

EUR/USD gained traction and turned positive on the day above 1.0650. The improvement seen in risk mood following the earlier flight to safety weighs on the US Dollar ahead of the weekend and helps the pair push higher.
GBP/USD recovers toward 1.2450 after UK Retail Sales data

GBP/USD reversed its direction and advanced to the 1.2450 area after touching a fresh multi-month low below 1.2400 in the Asian session. The positive shift seen in risk mood on easing fears over a deepening Iran-Israel conflict supports the pair.
Gold holds steady at around $2,380 following earlier spike

Gold stabilized near $2,380 after spiking above $2,400 with the immediate reaction to reports of Israel striking Iran. Meanwhile, the pullback seen in the US Treasury bond yields helps XAU/USD hold its ground.
Bitcoin Weekly Forecast: BTC post-halving rally could be partially priced in Premium

Bitcoin price shows no signs of directional bias while it holds above $60,000. The fourth BTC halving is partially priced in, according to Deutsche Bank’s research.
Week ahead – US GDP and BoJ decision on top of next week’s agenda

US GDP, core PCE and PMIs the next tests for the Dollar. Investors await BoJ for guidance about next rate hike. EU and UK PMIs, as well as Australian CPIs also on tap.