- A combination of factors assisted USD/CAD to stage a modest recovery from near four-year lows.
- Oversold RSI on the daily chart seemed to be the only factor that prompted some short-covering.
- The technical set-up still favours bearish traders and supports prospects for additional weakness.
The USD/CAD pair edged higher during the early North American session and refreshed daily tops, around the 1.2125 region in the last hour, albeit lacked follow-through.
Declining crude oil prices – now down over 1.30% for the day – undermined the commodity-linked loonie and extended some support to the USD/CAD pair. On the other hand, a modest uptick in the US Treasury bond yields extended some support to the US dollar. Apart from this, a steep fall in the equity markets further benefitted the greenback's relative safe-haven status against its Canadian counterpart.
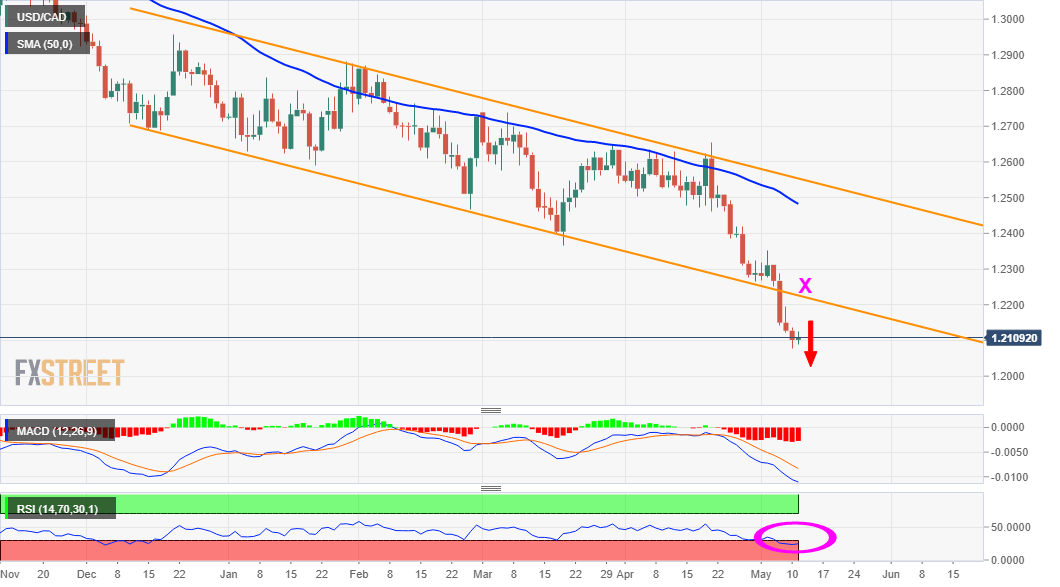
From a technical perspective, oversold RSI on the daily chart was seen as a key factor that prompted some short-covering move and assisted the USD/CAD pair to snap four days of the losing streak. That said, last week's sustained break below a multi-month descending channel supports prospects for an extension of the well-established bearish trend. This suggests that the attempted recovery might fizzle out quickly.
Hence, any subsequent positive move towards the 1.2145-50 region might be seen as an opportunity to initiate fresh bearish positions. This, in turn, should cap the USD/CAD pair near the mentioned trend-channel support breakpoint, now turned resistance near the 1.2200 round-figure mark. The mentioned handle should now act as a key pivotal point for short-term traders and help determine the near-term trajectory.
On the flip side, the 1.2100 mark now seems to protect the immediate downside ahead of the 1.2080-75 region, or near four-year lows touched on Monday. This is closely followed by September 2017 swing lows, around the 1.2060 region, which if broken decisively should pave the way for additional weakness. The USD/CAD pair might then turn vulnerable and accelerate the fall to challenge the key 1.2000 psychological mark.
USD/CAD daily chart
Technical levels to watch
Information on these pages contains forward-looking statements that involve risks and uncertainties. Markets and instruments profiled on this page are for informational purposes only and should not in any way come across as a recommendation to buy or sell in these assets. You should do your own thorough research before making any investment decisions. FXStreet does not in any way guarantee that this information is free from mistakes, errors, or material misstatements. It also does not guarantee that this information is of a timely nature. Investing in Open Markets involves a great deal of risk, including the loss of all or a portion of your investment, as well as emotional distress. All risks, losses and costs associated with investing, including total loss of principal, are your responsibility. The views and opinions expressed in this article are those of the authors and do not necessarily reflect the official policy or position of FXStreet nor its advertisers. The author will not be held responsible for information that is found at the end of links posted on this page.
If not otherwise explicitly mentioned in the body of the article, at the time of writing, the author has no position in any stock mentioned in this article and no business relationship with any company mentioned. The author has not received compensation for writing this article, other than from FXStreet.
FXStreet and the author do not provide personalized recommendations. The author makes no representations as to the accuracy, completeness, or suitability of this information. FXStreet and the author will not be liable for any errors, omissions or any losses, injuries or damages arising from this information and its display or use. Errors and omissions excepted.
The author and FXStreet are not registered investment advisors and nothing in this article is intended to be investment advice.
Recommended content
Editors’ Picks
AUD/USD rises to two-day high ahead of Aussie CPI

The Aussie Dollar recorded back-to-back positive days against the US Dollar and climbed more than 0.59% on Tuesday, as the US April S&P PMIs were weaker than expected. That spurred speculations that the Federal Reserve could put rate cuts back on the table. The AUD/USD trades at 0.6488 as Wednesday’s Asian session begins.
EUR/USD now refocuses on the 200-day SMA

EUR/USD extended its positive momentum and rose above the 1.0700 yardstick, driven by the intense PMI-led retracement in the US Dollar as well as a prevailing risk-friendly environment in the FX universe.
Gold struggles around $2,325 despite broad US Dollar’s weakness

Gold reversed its direction and rose to the $2,320 area, erasing a large portion of its daily losses in the process. The benchmark 10-year US Treasury bond yield stays in the red below 4.6% following the weak US PMI data and supports XAU/USD.
Bitcoin price makes run for previous cycle highs as Morgan Stanley pushes BTC ETF exposure

Bitcoin (BTC) price strength continues to grow, three days after the fourth halving. Optimism continues to abound in the market as Bitcoiners envision a reclamation of previous cycle highs.
Australia CPI Preview: Inflation set to remain above target as hopes of early interest-rate cuts fade

An Australian inflation update takes the spotlight this week ahead of critical United States macroeconomic data. The Australian Bureau of Statistics will release two different inflation gauges on Wednesday.