
Advertisement
Advertisement
AUD/USD Forex Technical Analysis – Trying to Establish Support Inside Retracement Zone at .7712 to .7669
By:
The direction of the AUD/USD on Friday is likely to be determined by trader reaction to the short-term 50% level at .7712.

In this article:
The Australian Dollar is edging lower early Friday after finding support the previous session following a steep loss on Wednesday.
The Aussie has been hit by a bought of risk aversion this week as global stocks slid and a startlingly strong reading for U.S. inflation sparked speculation the Federal Reserve might have to start tapering earlier than thought.
At 03:29 GMT, the AUD/USD is trading .7719, down 0.0010 or -0.12%.
Beijing also sounded alarms over the recent surge in iron ore prices, contributing to a sharp pullback in the commodity on Thursday after weeks of hefty gains. The recent sharp rise in iron ore helped carry the Aussie higher for weeks.
Daily Swing Chart Technical Analysis
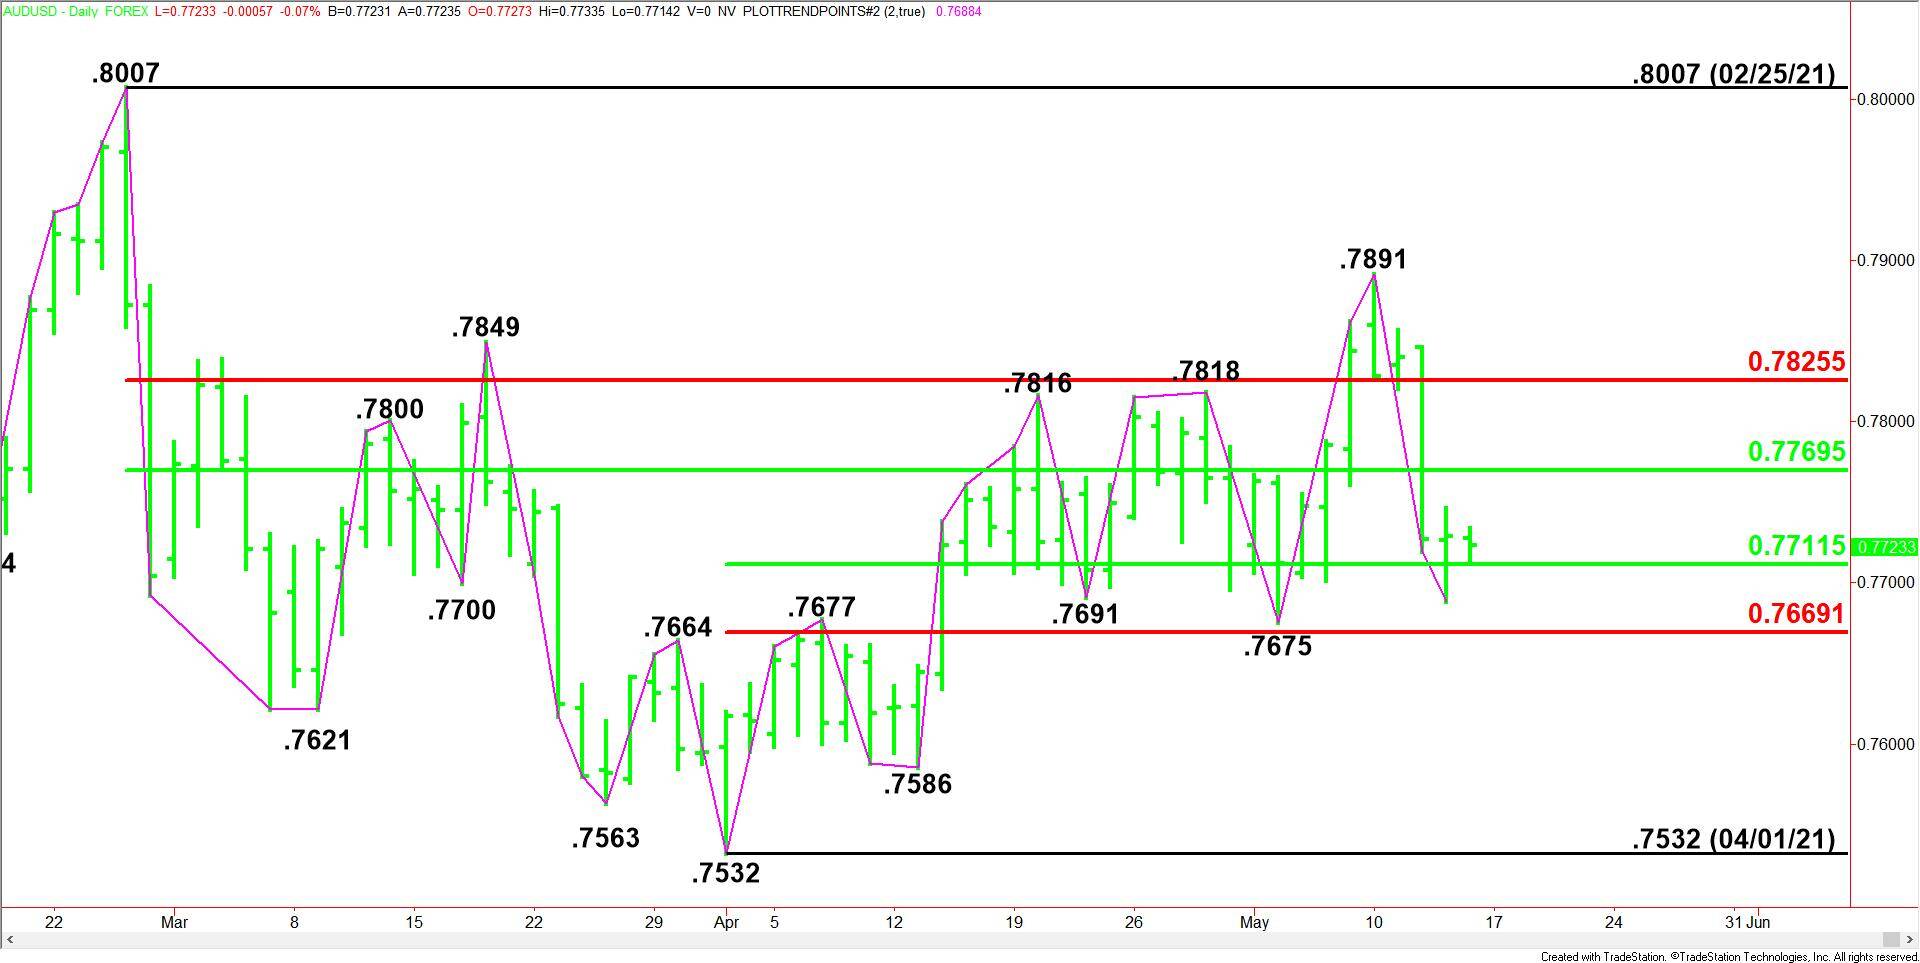
The main trend is up according to the daily swing chart, however, momentum has been trending lower since the formation of the closing price reversal top on May 10.
A trade through .7675 will change the main trend to down. A move through .7891 will negate the closing price reversal top and signal a resumption of the uptrend.
The short-term range is .7532 to .7891. The AUD/USD found support inside its retracement zone at .7712 to .7669 on Thursday.
The main range is .8007 to .7532. Its retracement zone at .7770 to .7826 is potential resistance. This zone is controlling the near-term direction of the Forex pair.
Daily Swing Chart Technical Forecast
The direction of the AUD/USD on Friday is likely to be determined by trader reaction to the short-term 50% level at .7712.
Bullish Scenario
A sustained move over .7712 will indicate the presence of buyers. If this move is able to create enough upside momentum then look for the rally to possibly extend into the main 50% level at .7770.
Bearish Scenario
A sustained move under .7711 will signal the presence of sellers. The first downside target is yesterday’s low at .7688, followed by the main bottom at .7675 and the short-term Fibonacci level at .7669.
The Fib level at .7669 is a potential trigger point for an acceleration to the downside with .7586 the next likely downside target.
For a look at all of today’s economic events, check out our economic calendar.
About the Author
James Hyerczykauthor
James is a Florida-based technical analyst, market researcher, educator and trader with 35+ years of experience. He is an expert in the area of patterns, price and time analysis as it applies to futures, Forex, and stocks.
Did you find this article useful?
Latest news and analysis


Advertisement