
Advertisement
Advertisement
USD/JPY Forex Technical Analysis – Strengthens Over 109.634, Weakens Under 109.223
By:
The direction of the USD/JPY on Friday is likely to be determined by trader reaction to the short-term Fibonacci level at 109.634.

In this article:
The Dollar/Yen is inching higher early Friday despite posting a potentially bearish closing price reversal top the previous session. Sellers took control on Thursday after the Forex pair reached its highest level since April 9 following a drop in U.S. Treasury yields.
At 05:34 GMT, the USD/JPY is trading 109.523, up 0.075 or +0.07%.
U.S. Treasury yields fell slightly on Thursday after more hot inflation data. The yield on the benchmark 10-year Treasury note fell about 3 basis points to 1.67%. The yield on the 30-year Treasury bond dipped 2 basis points to 2.4%.
While Wednesday’s stronger-than-expected U.S. CPI report drove yields and the Dollar/Yen sharply higher, yesterday’s U.S. PPI report may have had the opposite effect.
April’s Producer Price Index (PPI) rose 0.6% from the previous month, compared to the rise of 0.3% estimated by economists, according to Dow Jones.
Investors may have also been influenced by the U.S. Weekly Jobless Claims report that showed the number of Americans filing new claims for unemployment benefits dropped to a 14-month low last week.
Daily Swing Chart Technical Analysis
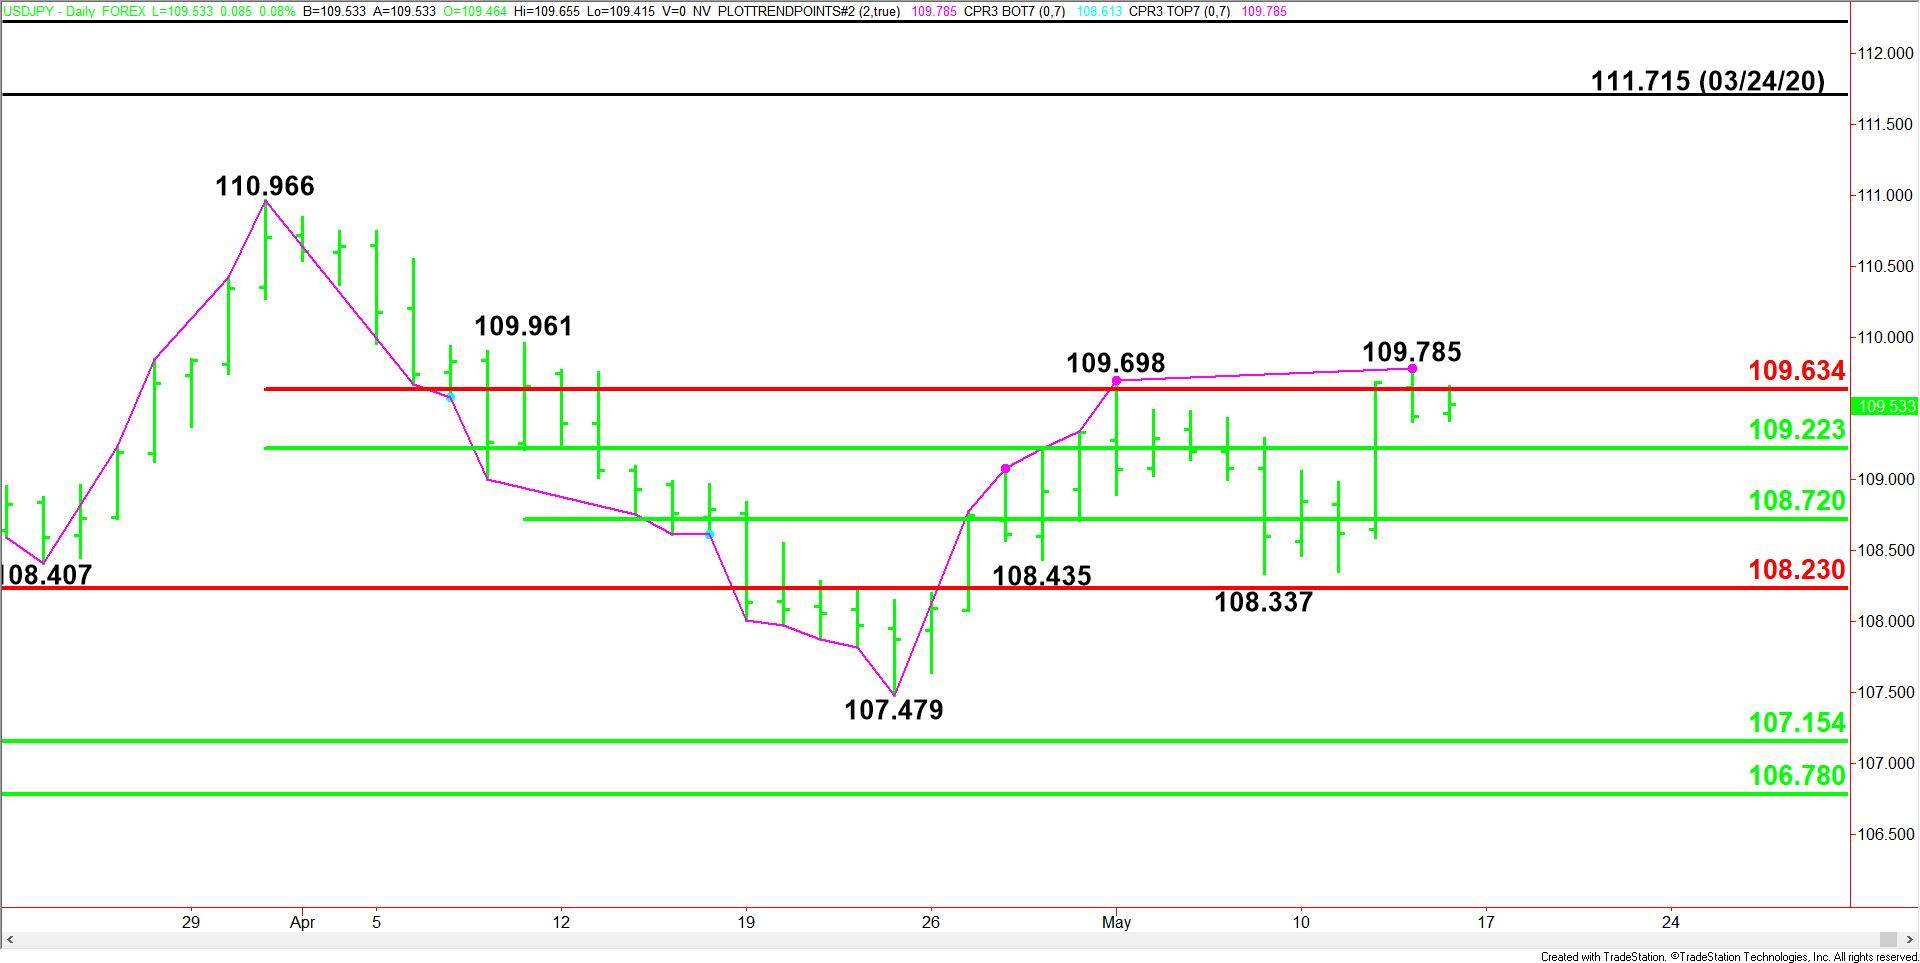
The main trend is down according to the daily swing chart, however, momentum is trending higher. The main trend will change to up on a trade through 110.966. A move through 107.479 will signal a resumption of the downtrend.
The minor trend is up. This is controlling the momentum. A trade through 109.785 will negate yesterday’s minor reversal top. A move through 109.407 will confirm the reversal top, indicating renewed selling pressure.
The short-term range is 110.966 to 107.479. The USD/JPY is currently testing its retracement zone at 109.223 to 109.634. This zone is controlling the near-term direction of the Forex pair.
109.861 to 107.479 is a minor retracement zone. Its 50% level or pivot at 108.720 is a potential downside target.
The major support is the Fibonacci level at 108.230.
Daily Swing Chart Technical Forecast
The direction of the USD/JPY on Friday is likely to be determined by trader reaction to the short-term Fibonacci level at 109.634.
Bearish Scenario
A sustained move under 109.634 will indicate the presence of sellers. If this creates enough downside momentum then look for the selling to possibly extend into the short-term 50% level at 109.223. If this level fails then look for an acceleration into 108.720.
Bullish Scenario
A sustained move over 109.634 will signal the presence of buyers. The first target is 109.785. Taking out this level could trigger an acceleration to the upside.
For a look at all of today’s economic events, check out our economic calendar.
About the Author
James Hyerczykauthor
James is a Florida-based technical analyst, market researcher, educator and trader with 35+ years of experience. He is an expert in the area of patterns, price and time analysis as it applies to futures, Forex, and stocks.
Did you find this article useful?
Latest news and analysis


Advertisement