
Bitcoin Vs. Bitcoin Cash: A Technical Comparison

Bitcoin (CRYPTO: BTC), the world's biggest cryptocurreny, has continued its steady rise and throughout time more variants of the coin were made when liquidity issues came around in Bitcoin.
Bitcoin Cash (CRYPTO: BCH) is one of these variants. Bitcoin Cash is its own cryptocurrency, and the main difference between it and Bitcoin is the block sizes were increased to help with making transactions smoother.
Below is a technical look at their charts.
(Click on image to enlarge)
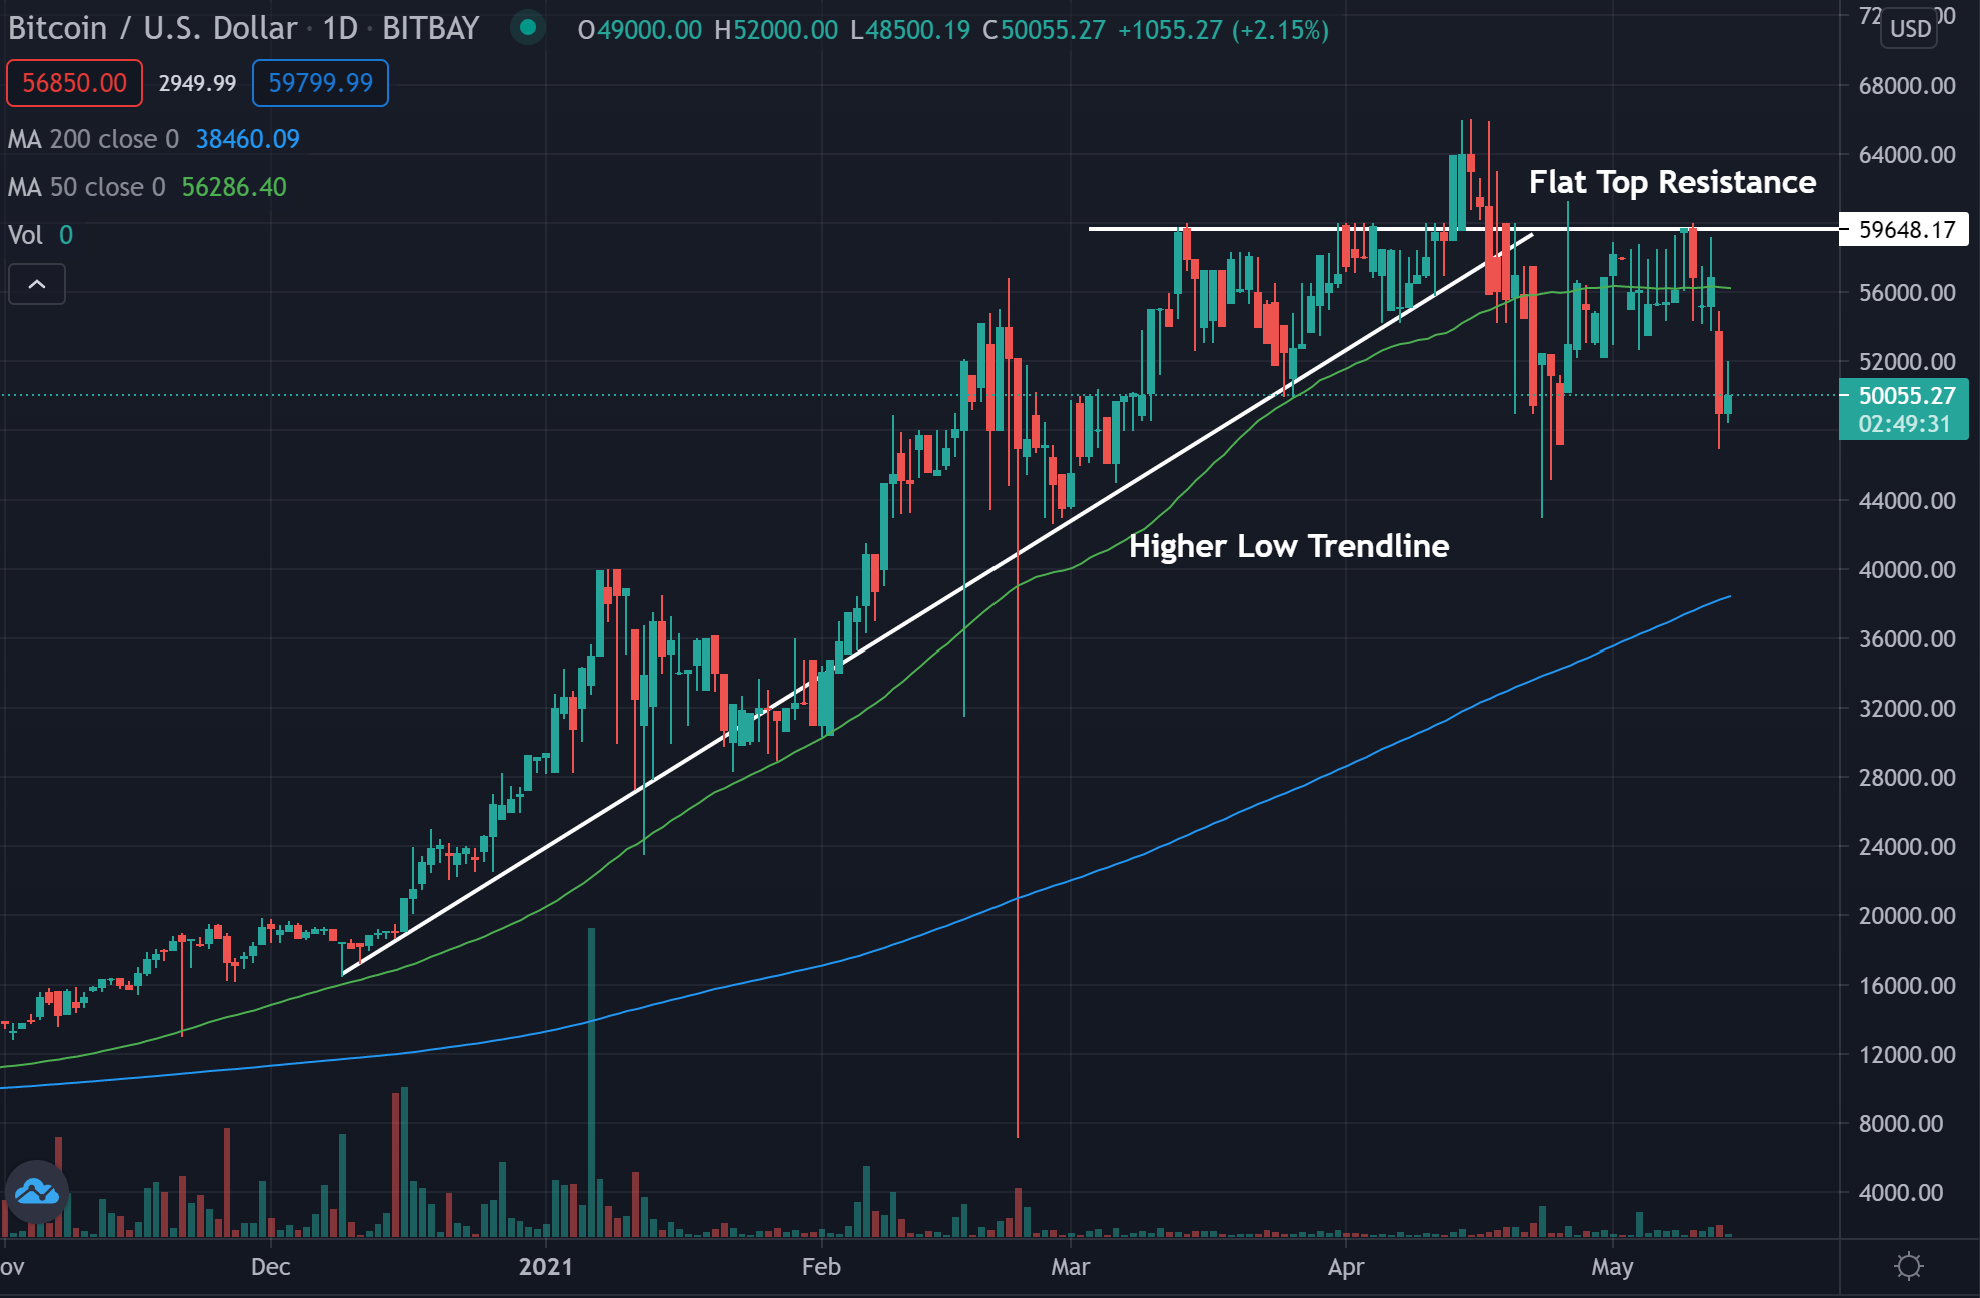
Bitcoin Daily Chart Analysis
- Bitcoin looks like it was unable to break out of the ascending triangle pattern. It will need to break out of resistance before it sees a higher move.
- Bitcoin is trading below the 50-day moving average (green), but above the 200-day moving average (blue), indicating the sentiment has been bullish.
- The 50-day moving average may hold as an area of resistance, while the 200-day moving average may hold as support.
Key Levels To Watch
- The ascending triangle was unable to break out when Bitcoin rose above $60,000, but was unable to hold its gains.
- The crypto is showing a resistance level near the $60,000 mark as this has been an area the price struggles to cross above.
- Bitcoin looks to have broken below the higher low trendline, possibly a warning sign that it could move lower.
(Click on image to enlarge)
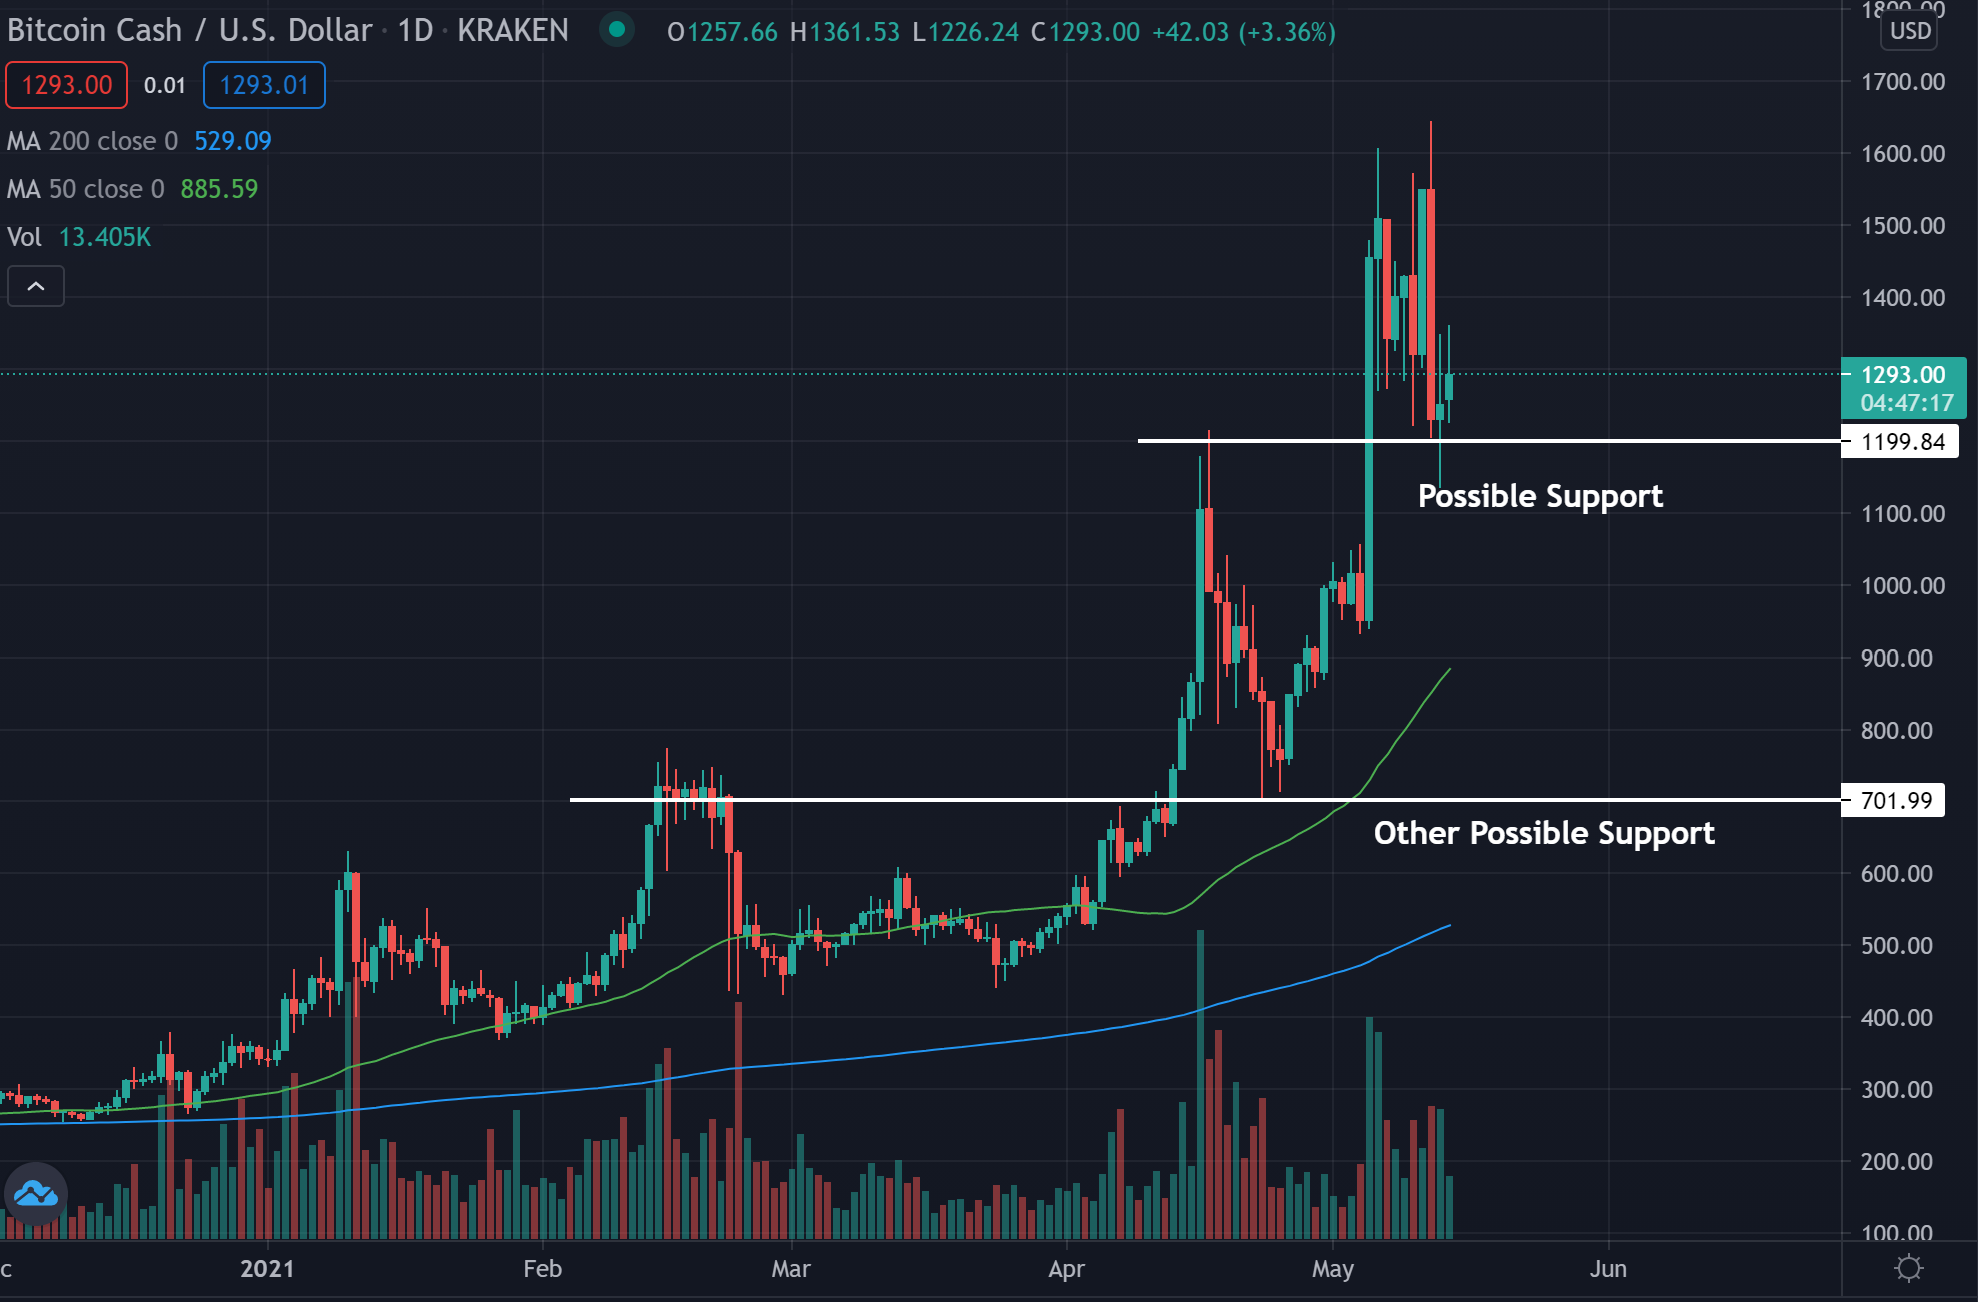
Bitcoin Cash Daily Chart Analysis
- Bitcoin Cash has been steadily climbing and has broken through multiple resistance lines
- Bitcoin Cash is trading above both the 50-day moving average (green) and the 200-day moving average (blue), indicating the sentiment has been bullish.
- Both of these moving averages may hold as a potential area of support.
Key Levels To Watch
- Bitcoin Cash is looking to find support near the $1,200 level, an area previously held as resistance.
- If the $1,200 area is unable to hold, the $700 mark held as both a resistance level and then a support level in the past.
- This $700 support level may hold again in the future.
- Sentiment should stay bullish as the price trades above both moving averages.
© 2021 Benzinga.com. Benzinga does not provide investment advice. All rights reserved.
How did you like this article? Let us know so we can better customize your reading experience.

Comments
Leave a comment to automatically be entered into
our contest to win a free Echo Show.

