
Advertisement
Advertisement
EOS, Stellar’s Lumen, and Tron’s TRX – Daily Analysis – May 18th, 2021
By:
It's a bullish start to the day for the majors. Following yesterday's sell-off, however, failure to revisit early highs could lead to a reversal.

In this article:
EOS
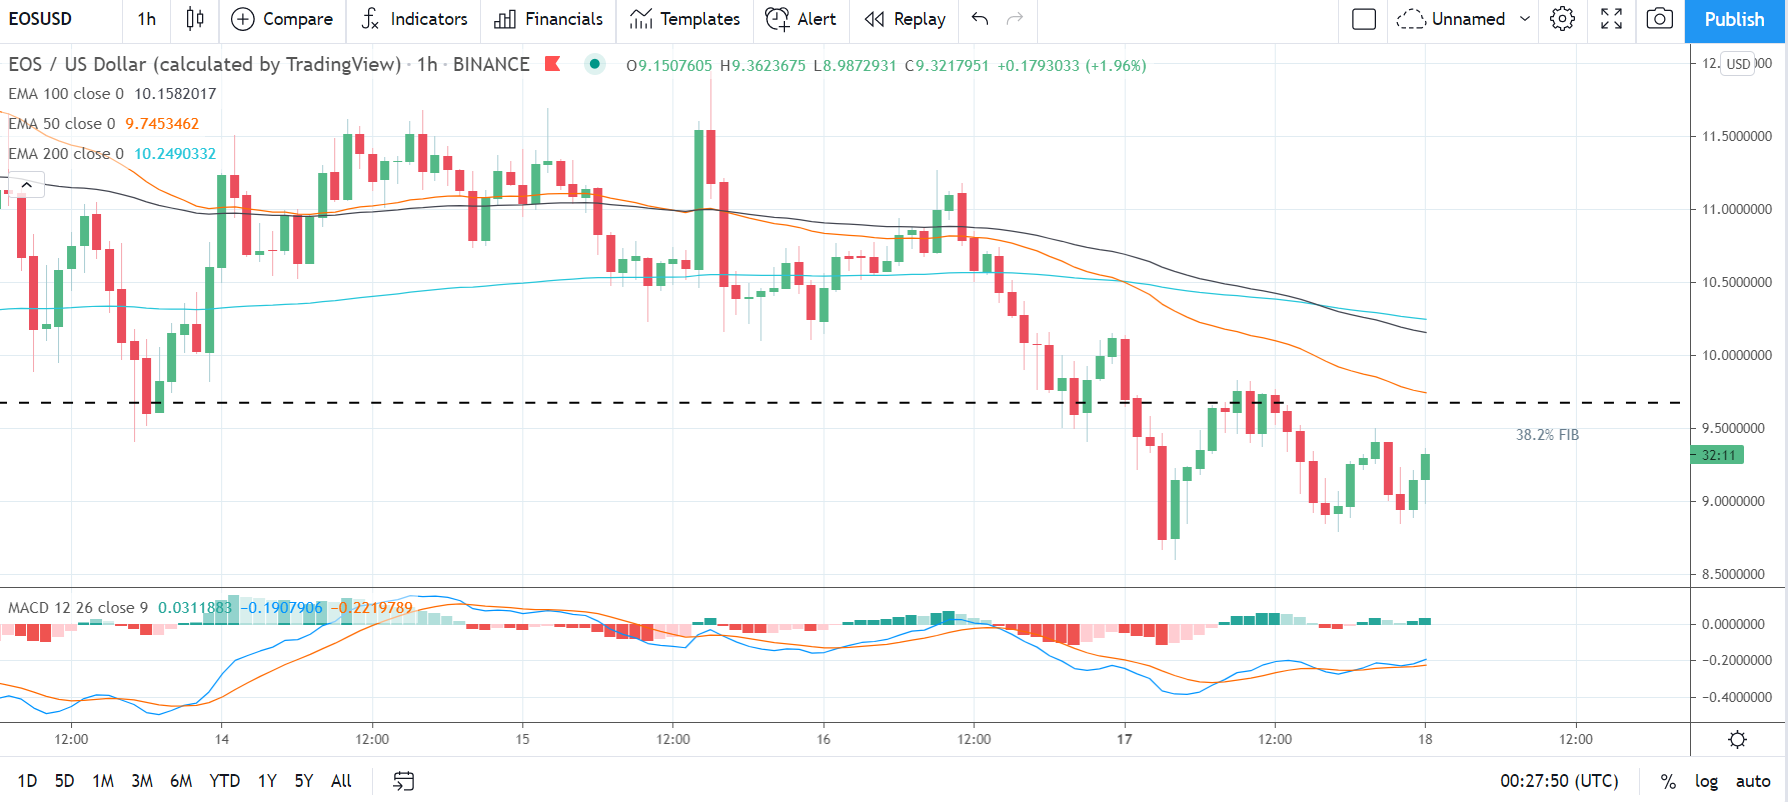
EOS slid by 9.60% on Monday. Following a 1.24% decline on Sunday, EOS ended the day at $9.1425.
A mixed start to the day saw EOS rise to a late morning intraday high $10.1376 before hitting reverse.
Falling short of the first major resistance level at $11.0979, EOS slid to a mid-morning intraday low $8.6045.
The reversal saw EOS fall through the 38.2% FIB of $9.68 and the first major support level at $9.2799.
Steering clear of the second major support level at $8.4415, EOS briefly broke back through the 38.2% FIB before sliding back to sub-$9.00 levels.
Finding late support, however, EOS moved back through to $9.00 levels to reduce the deficit.
At the time of writing, EOS was up by 1.96% to $9.3218. A mixed start to the day saw EOS fall to an early morning low $8.9873 before rising to a high $9.3624.
EOS left the major support and resistance levels untested early on.
For the day ahead
EOS would need to avoid a fall back through the $9.2949 pivot to bring the 38.2% FIB of $9.68 and the first major resistance level at $9.9852 into play.
Support from the broader market would be needed for EOS to break back through to $9.90 levels.
Barring another extended rally throughout the day, the first major resistance level and Monday’s high $10.1376 would likely cap the upside.
In the event of another extended breakout, EOS could test resistance at $11.00 levels. The second major resistance level sits at $10.8280.
Failure to avoid a fall back through the $9.2949 pivot would bring the first major support level at $8.4521 into play.
Barring another extended sell-off, however, EOS should steer clear of the second major support level at $7.7618.
Looking at the Technical Indicators
First Major Support Level: $8.4521
First Major resistance Level: $9.9852
23.6% FIB Retracement Level: $6.52
38% FIB Retracement Level: $9.68
62% FIB Retracement Level: $14.77
Stellar’s Lumen
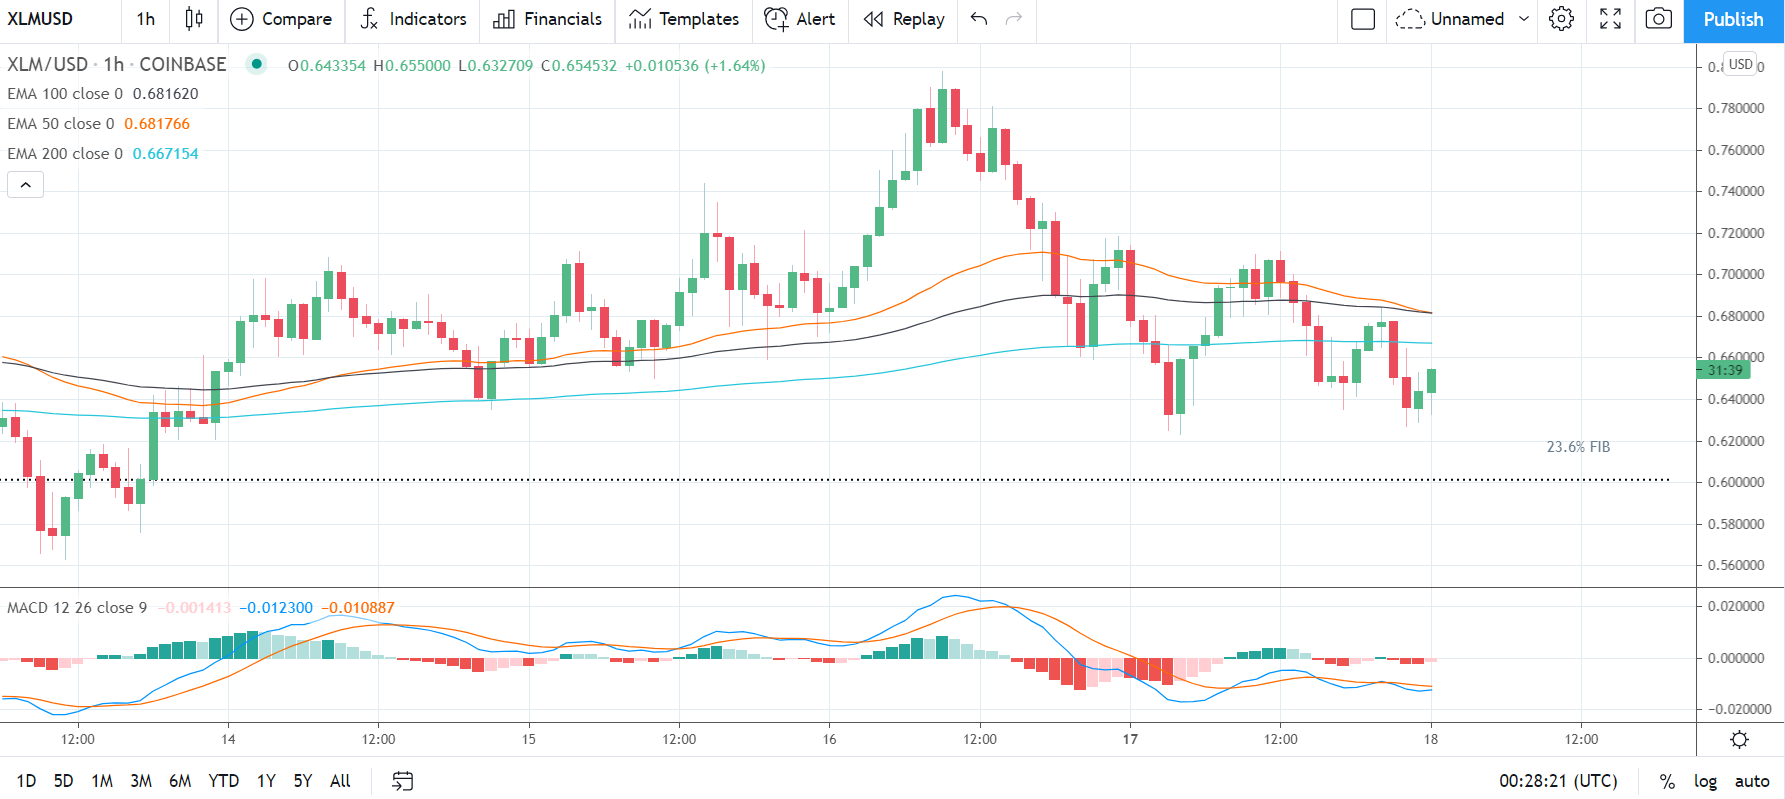
Stellar’s Lumen slid by 9.50% on Monday. Reversing a 4.32% gain from Sunday, Stellar’s Lumen ended the day at $0.6440.
A mixed start to the day saw Stellar’s Lumen rise to an early morning intraday high $0.7139 before hitting reverse.
Falling well short of the first major resistance level at $0.7866, Stellar’s Lumen slid to a mid-morning intraday low $0.6233.
The reversal saw Stellar’s Lumen fall through the first major support level at $0.6478 before revisiting $0.70 levels.
A 2nd sell-off, however, saw Stellar’s Lumen slide back through the first major support level at $0.6478 to end the day at $0.644 levels.
At the time of writing, Stellar’s Lumen was up by 1.64% to $0.6545. A mixed start to the day saw Stellar’s Lumen fall to an early morning low $0.6327 before rising to a high $0.6550.
Stellar’s Lumen left the major support and resistance levels untested early on.
For the day ahead
Stellar’s Lumen would need to move through the pivot level at $0.6604 to bring the first major resistance level at $0.6975 into play.
Support from the broader market would be need, however, for Stellar’s Lumen to break back through to $0.69 levels.
Barring an extended rally, the first major resistance level and resistance at $0.70 would likely cap any upside.
In the event of an extended rally, Stellar’s Lumen could test resistance at Sunday’s new swing hi $0.7978. The second major resistance level sits at $0.7510.
Failure to move through the $0.6604 pivot would bring the 23.6% FIB of $0.6160 and the first major support level at $0.6069 into play.
Barring an extended sell-off on the day, Stellar’s Lumen should steer clear of the second major support level at $0.5698.
Looking at the Technical Indicators
First Major Support Level: $0.6069
First Major Resistance Level: $0.6975
23.6% FIB Retracement Level: $0.6160
38% FIB Retracement Level: $0.5035
62% FIB Retracement Level: $0.3216
Tron’s TRX
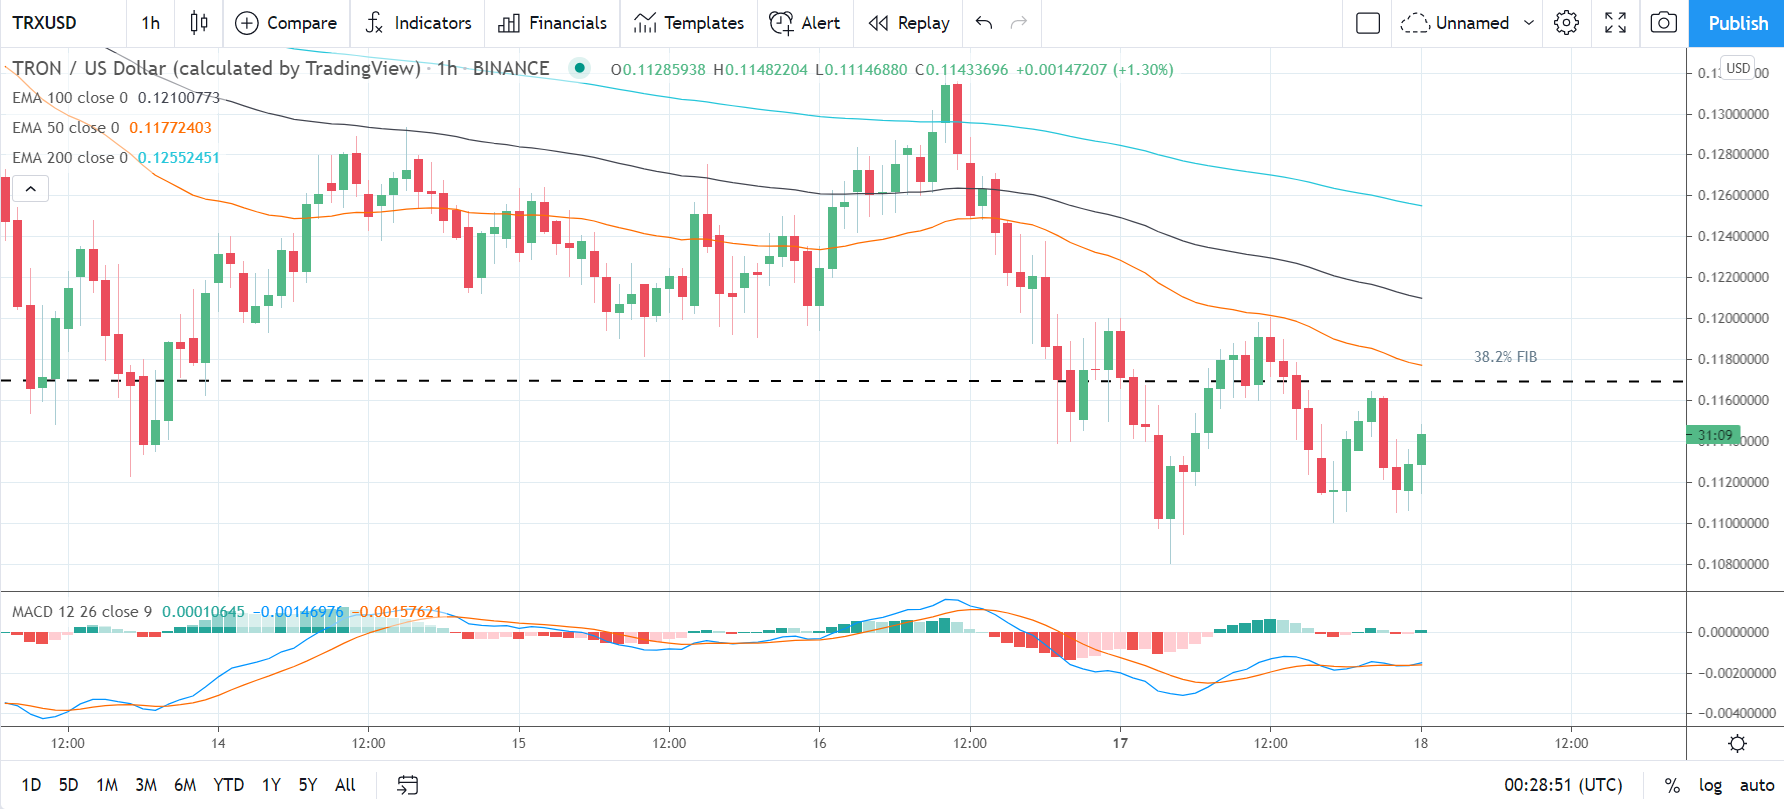
Tron’s TRX fell by 5.44% on Monday. Following a 1.00% loss on Sunday, Tron’s TRX ended the day at $0.1129.
Tracking the broader market, Tron’s TRX rose to an early morning high $0.1200 before hitting reverse.
Falling short of the first major resistance level at $0.1292, Tron’s TRX slid to a mid-morning intraday low $0.1081.
The sell-off saw Tron’s TRX slide through the 38.2% FIB of $0.1167 and the first major support level at $0.1120.
Steering clear of the second major support level at $0.1047, Tron’s TRX struck a mid-day intraday high $0.1201 before hitting reverse.
Tron’s TRX fell back through the 38.2% FIB and the first major support level at $0.1120 before a partial recovery to $0.1129 levels.
At the time of writing, Tron’s TRX was up by 1.30% to $0.1143. A mixed start to the day saw Tron’s TRX fall to an early morning low $0.1115 before rising to a high $0.1148.
Tron’s TRX left the major support and resistance levels untested early on.
For the Day Ahead
Tron’s TRX would need to avoid a fall back through the pivot at $0.1137 to bring the 38.2% FIB of $0.1167 and the first major resistance level at $0.1193 into play.
Support from the broader market would be needed, however, for Tron’s TRX to break out from the 38.2% FIB.
Barring an extended crypto rally, the first major resistance level and Monday’s high $0.1201 would likely cap any upside.
In the event of an extended rally Tron’s TRX could test resistance at $0.13 before any pullback. The second major resistance level sits at $0.1257.
Failure to avoid a fall back through the $0.1137 pivot would bring the first major support level at $0.1073 into play.
Barring another extended sell-off, Tron’s TRX should steer clear of sub-$0.10 levels. The second major support level at $0.1017 should limit the downside.
Looking at the Technical Indicators
First Major Support Level: $0.1073
First Major Resistance Level: $0.1193
23.6% FIB Retracement Level: $0.1426
38.2% FIB Retracement Level: $0.1167
62% FIB Retracement Level: $0.0748
Please let us know what you think in the comments below
Thanks, Bob
About the Author
Bob Masonauthor
With over 20 years of experience in the finance industry, Bob has been managing regional teams across Europe and Asia and focusing on analytics across both corporate and financial institutions. Currently he is covering developments relating to the financial markets, including currencies, commodities, alternative asset classes, and global equities.
Did you find this article useful?
Latest news and analysis


Advertisement