
Advertisement
Advertisement
Ethereum, Litecoin, and Ripple’s XRP – Daily Tech Analysis – May 21st, 2021
By:
It's a bullish start to the day for the majors. Steering clear of the day's pivot levels would support another day of solid gains.
Ethereum
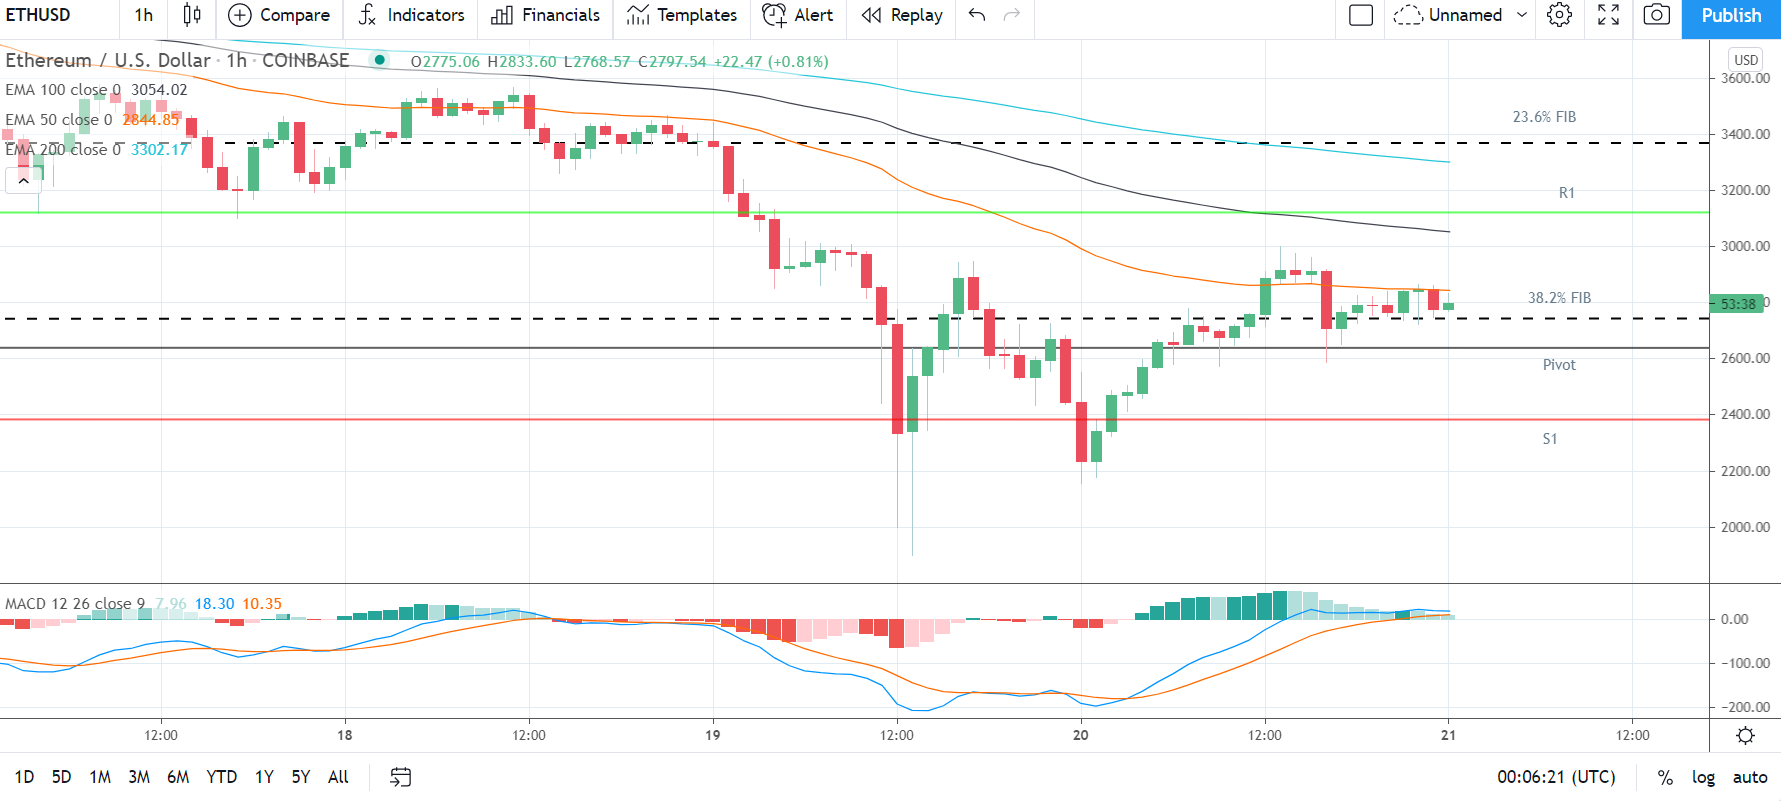
Ethereum rallied by 11.55% on Thursday. Partially reversing a 27.63% tumble from Wednesday, Ethereum ended the day at $2,775.07.
A mixed start to the day saw Ethereum fall to an early morning intraday low $2,156.00 before making a move.
Steering clear of the first major support level at $1,748, Ethereum rallied to an early afternoon intraday high $2,999.99.
While falling short of the first major resistance level at $3,293, Ethereum broke back through the 38.2% FIB of $2,740.
A late afternoon pullback saw Ethereum briefly fall back through the 38.2% FIB before ending the day at $2,770 levels.
At the time of writing, Ethereum was up by 0.81% to $2,797.54. A mixed start to the day saw Ethereum fall to an early morning low $2,768.57 before rising to a high $2,833.60.
Ethereum left the major support and resistance levels untested early on.
For the day ahead
Ethereum would need to avoid the 38.2% FIB of $2,740 and the $2,644 pivot to bring the first major resistance level at $3,131 into play.
Support from the broader market would be needed, however, for Ethereum to break back through to $3,000 levels.
Barring an extended crypto rally, the first major resistance level would likely cap any upside.
In the event of another broad-based crypto rally, Ethereum could test resistance at the 23.6% FIB of $3,369 and resistance at $3,500. The second major resistance level sits at $3,488.
Failure to avoid a fall through the 38.2% FIB and the $2,644 pivot would bring the first major support level at $2,287 into play.
Barring another extended sell-off, however, Ethereum should steer clear of sub-$2,000 levels. The second major support level sits at $1,800.
Looking at the Technical Indicators
First Major Support Level: $2,287
Pivot Level: $2,644
First Major Resistance Level: $3,131
23.6% FIB Retracement Level: $3,369
38.2% FIB Retracement Level: $2,740
62% FIB Retracement Level: $1,725
Litecoin
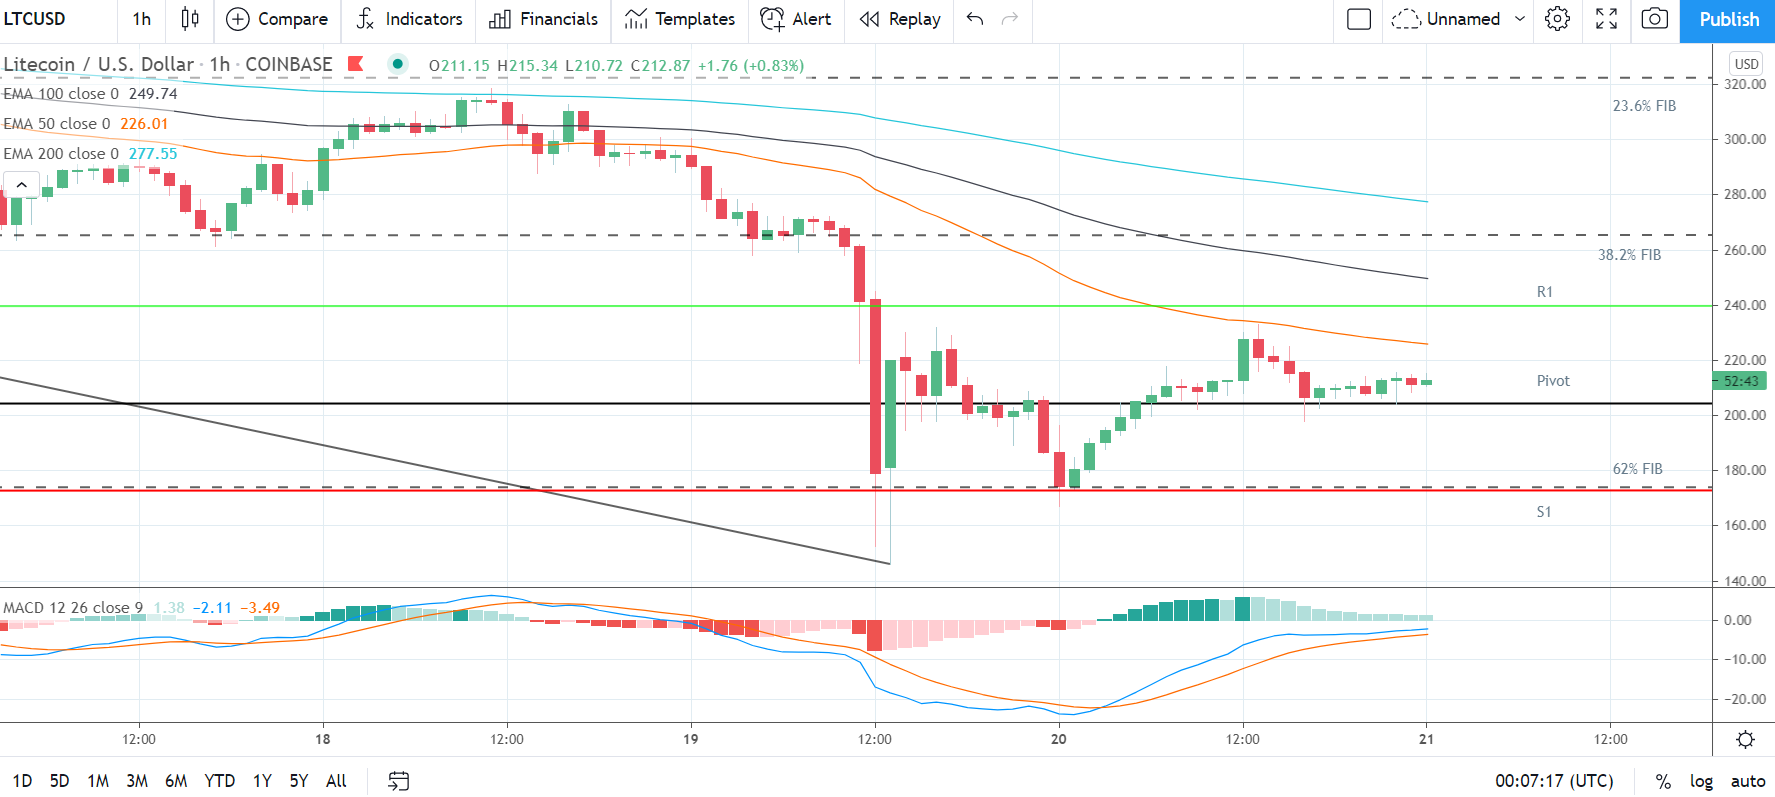
Litecoin rallied by 13.10% on Thursday. Partially reversing a 36.54% slump from Wednesday, Litecoin ended the day at $211.11.
A mixed start to the day saw Litecoin fall to an early morning intraday low $166.95 before making a move.
While steering clear of the first major support level at $122, Litecoin briefly fell through the 62% FIB of $165.
Finding early morning support, however, Litecoin rallied to an early afternoon intraday high $232.99.
Falling short of the 38.2% FIB of $265 and the first major resistance level at $276, Litecoin fell back to sub-$200 levels before ending the day at $211 levels.
At the time of writing, Litecoin was up by 0.83% to $212.87. A mixed start to the day saw Litecoin fall to an early morning low $210.72 before rising to a high $215.34.
Litecoin left the major support and resistance levels untested early on.
For the day ahead
Litecoin would need to avoid the $204 pivot to bring the first major resistance level at $240 into play.
Support from the broader market would be needed, however, for Litecoin to break out from Thursday’s high $232.99.
Barring an extended crypto rally, the first major resistance level would likely cap any upside.
In the event of an extended breakout, Litecoin could test resistance at the 38.2% FIB of $265. The second major resistance level sits at $270.
Failure to avoid the $204 pivot would bring the 62% FIB of $174 and the first major support level at $174 into play.
Barring another extended sell-off, however, Litecoin should steer clear of sub-$170 levels. The second major support level sits at $138.
Looking at the Technical Indicators
First Major Support Level: $174
Pivot Level: $204
First Major Resistance Level: $240
23.6% FIB Retracement Level: $322
38.2% FIB Retracement Level: $265
62% FIB Retracement Level: $174
Ripple’s XRP
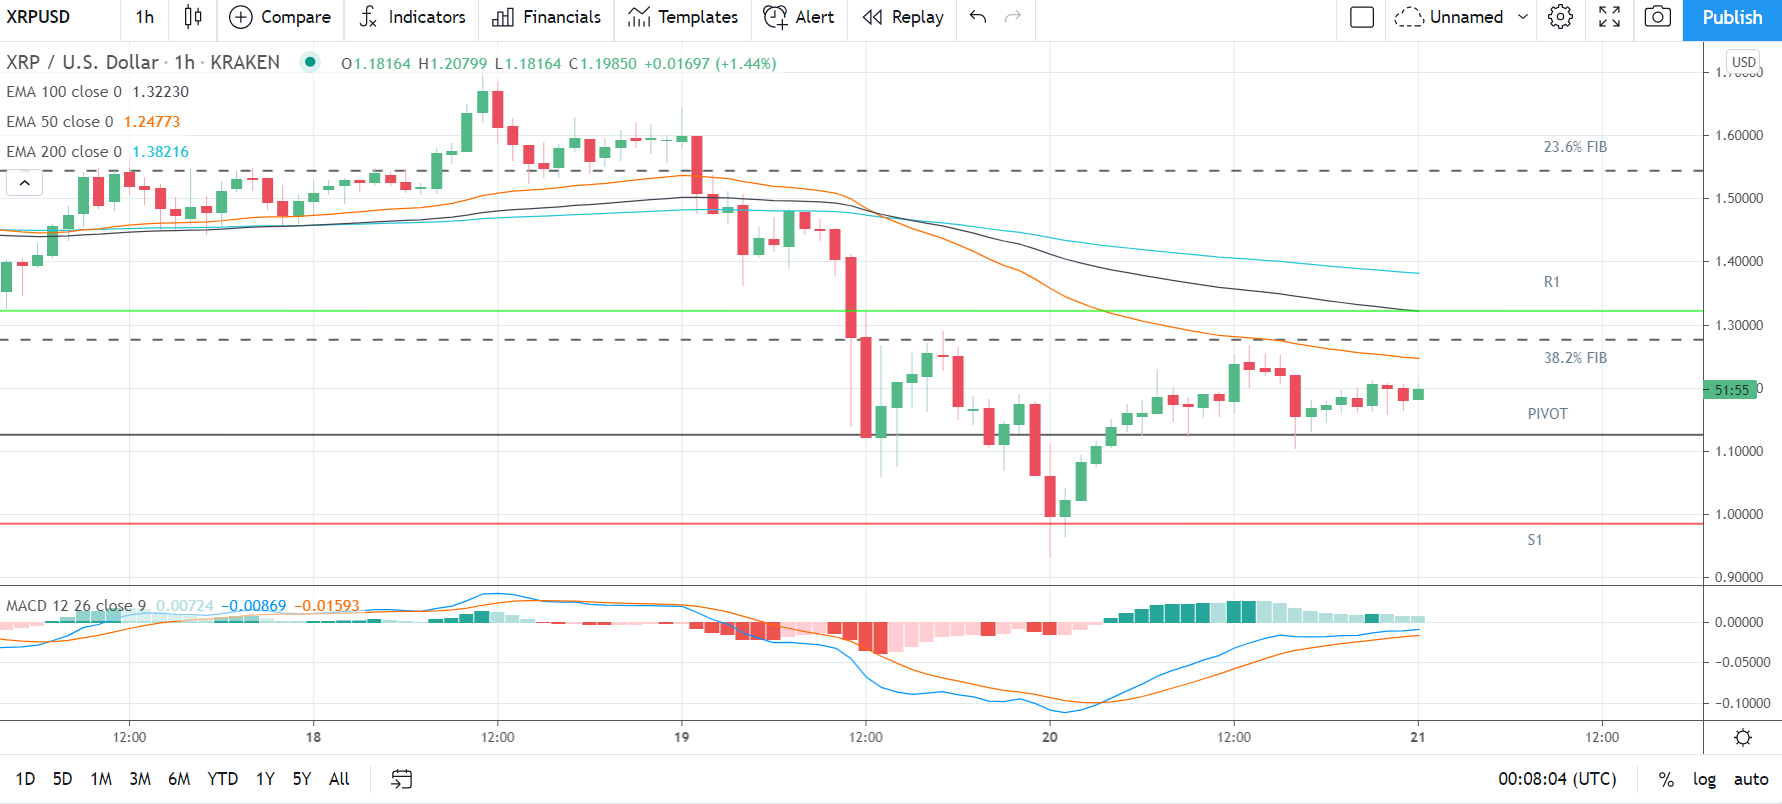
Ripple’s XRP rallied by 11.42% on Thursday. Partially reversing Wednesday’s 33.23% tumble, Ripple’s XRP ended the day $1.18153.
A mixed start to the day saw Ripple’s XRP fall to an early morning intraday low $0.93300 before making a move.
Steering clear of the first major support level at $0.8668, Ripple’s XRP rallied to an early afternoon intraday high $1.26853.
Falling short of the 38.2% FIB of $1.2807 and the first major resistance level at $1.4509, Ripple’s XRP fell back to end the day at sub-$1.20 levels.
At the time of writing, Ripple’s XRP was up by 1.44% to $1.19850. A bullish start to the day saw Ripple’s XRP rise from an early morning low $1.18164 to a high $1.20799.
Ripple’s XRP left the major support and resistance levels untested early on.
For the day ahead
Ripple’s XRP will need to avoid the $1.1277 pivot to bring the 38.2% FIB of $1.2807 and the first major resistance level at $1.3224 into play.
Support from the broader market would be needed, however, for Ripple’s XRP to break back through to $1.30 levels.
Barring an extended crypto rally, the first major resistance level would likely cap any upside.
In the event of an extended rally, Ripple’s XRP could test resistance at $1.50 levels. The second major resistance level sits at $1.4632.
Failure to avoid the $1.1277 pivot would bring the first major support level at $0.9868 into play.
Barring another extended sell-off, however, Ripple’s XRP should steer clear of the 62% FIB of $0.8573. The second major support level sits at $0.7922.
Looking at the Technical Indicators
First Major Support Level: $0.9868
Pivot Level: $1.1277
First Major resistance Level: $1.3224
23.6% FIB Retracement Level: $1.5426
38.2% FIB Retracement Level: $1.2807
62% FIB Retracement Level: $0.8573
Please let us know what you think in the comments below.
Thanks, Bob
About the Author
Bob Masonauthor
With over 20 years of experience in the finance industry, Bob has been managing regional teams across Europe and Asia and focusing on analytics across both corporate and financial institutions. Currently he is covering developments relating to the financial markets, including currencies, commodities, alternative asset classes, and global equities.
Did you find this article useful?
Latest news and analysis


Advertisement