
Advertisement
Advertisement
EOS, Stellar’s Lumen, and Tron’s TRX – Daily Analysis – May 26th, 2021
By:
It's a mixed start to the day for the majors. Failure to move through early morning high's would leave the day's major support levels in play.

In this article:
EOS
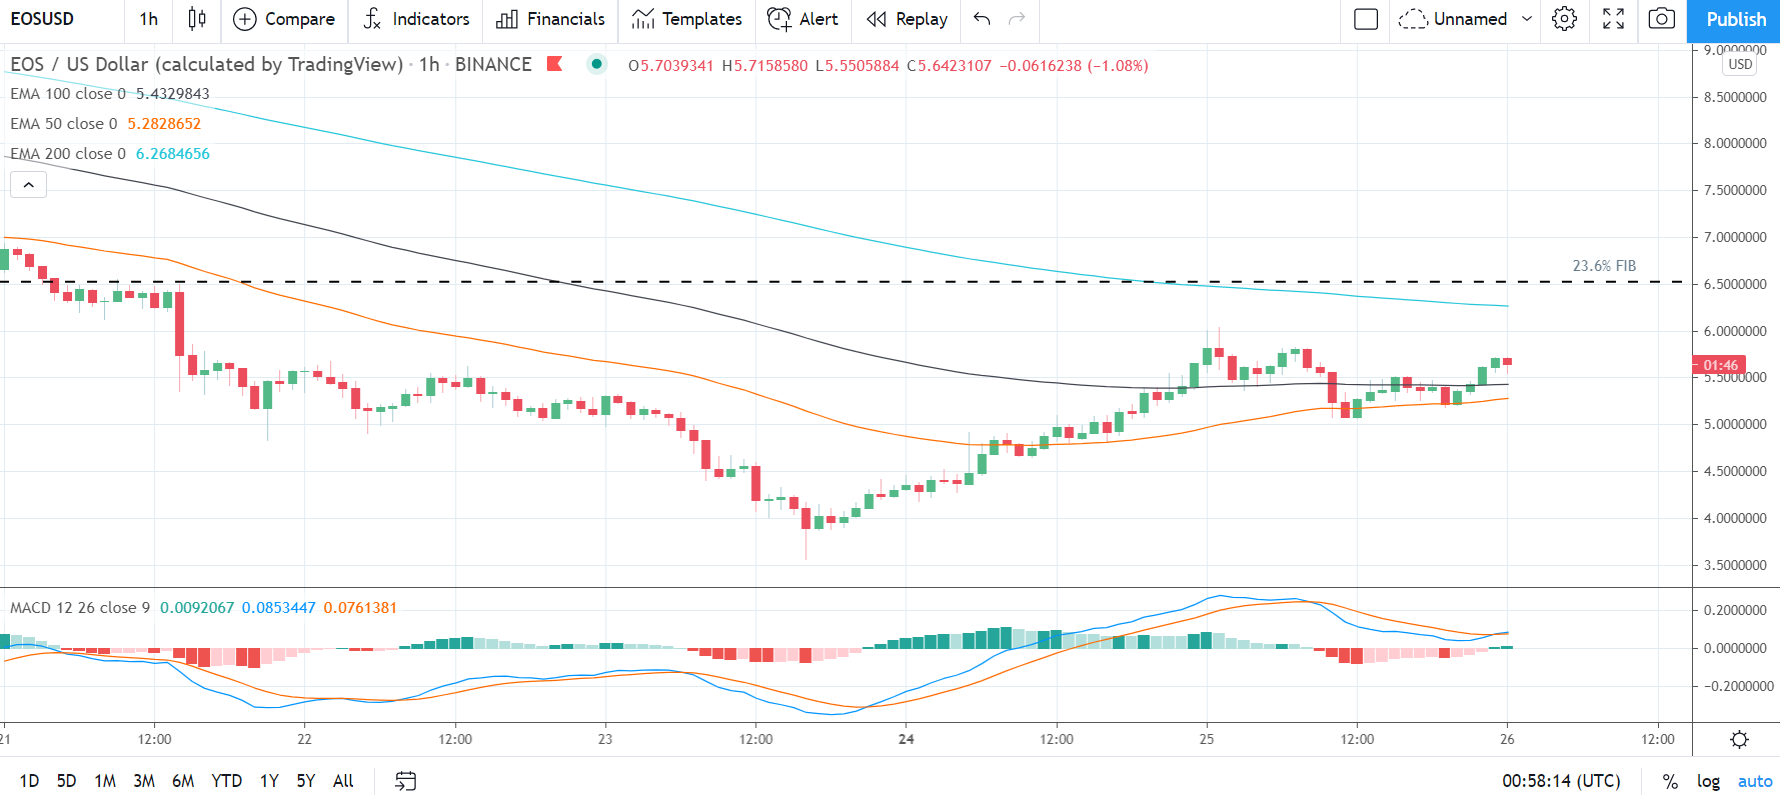
EOS rose by 1.03% on Tuesday. Consolidating a 31.34% surge from Monday, EOS ended the day at $5.70
A bullish start to the day saw EOS rise to an early morning intraday high $6.0353 before hitting reverse.
Falling short of the first major resistance level at $6.1391, EOS slid to a mid-day intraday low $5.0657.
Steering clear of the first major support level at $4.6697, EOS revisited $5.71 levels before easing back.
At the time of writing, EOS was down by 1.08% to $5.6423. A mixed start to the day saw EOS rise to an early morning high $5.7159 before falling to a low $5.5506.
EOS left the major support and resistance levels untested early on.
For the day ahead
EOS would need to avoid a fall back through the $5.6016 pivot to bring the first major resistance level at $6.1376 into play.
Support from the broader market would be needed for EOS to break back through to $6.0 levels.
Barring a broad-based crypto rebound, the first major resistance level and Tuesday’s high $6.0353 would likely cap any upside.
In the event of an extended breakout, EOS could test resistance at the 23.6% FIB of $6.52. The second major resistance level sits at $6.5712.
Failure to avoid a fall back through the $5.6016 pivot and would bring the first major support level at $5.1680 into play.
Barring an extended sell-off, however, EOS should steer clear of sub-$5.00 levels. The second major support level at $4.6320.
Looking at the Technical Indicators
First Major Support Level: $5.1680
First Major resistance Level: $6.1376
23.6% FIB Retracement Level: $6.52
38% FIB Retracement Level: $9.68
62% FIB Retracement Level: $14.77
Stellar’s Lumen
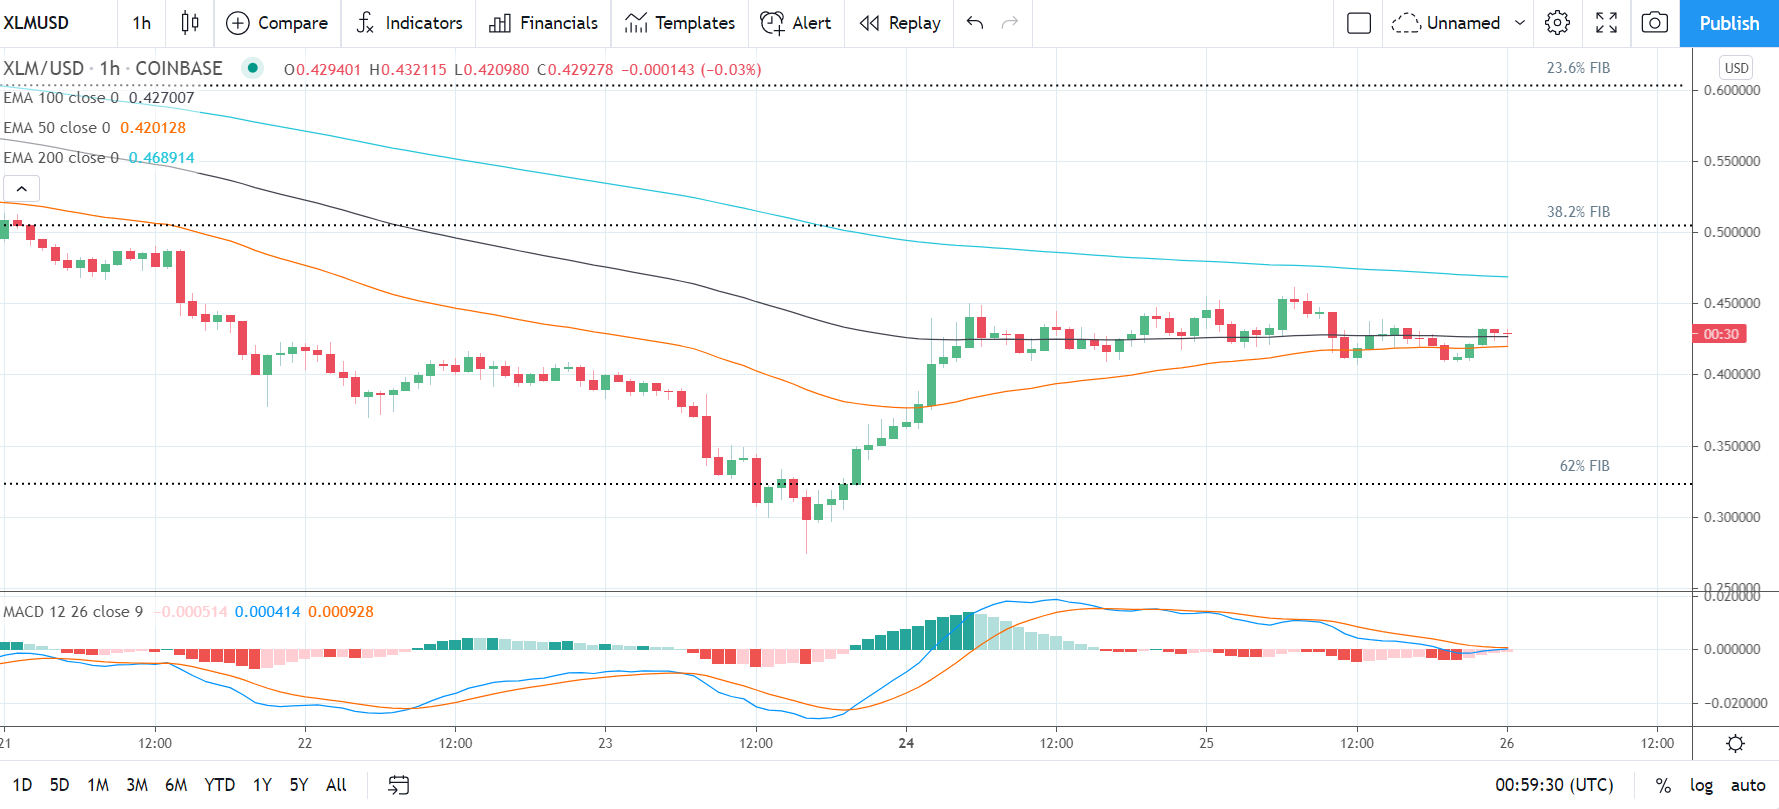
Stellar’s Lumen fell by 2.43% on Tuesday. Partially reversing a 20.86% rally from Monday, Stellar’s Lumen ended day at $0.4294.
A mixed start to the day saw Stellar’s Lumen rise to mid-morning intraday high $0.4615 before hitting reverse.
Falling short of the first major resistance level at $0.4728, Stellar’s Lumen fell to a mid-day intraday low $0.4069.
Steering clear of the first major support level at $0.3843, Stellar’s Lumen revisited $0.43 levels before easing back.
At the time of writing, Stellar’s Lumen was down by 0.03% to $0.4293. A mixed start to the day saw Stellar’s Lumen rise to an early morning high $0.4321 before falling to a low $0.4210.
Stellar’s Lumen left the major support and resistance levels untested early on.
For the day ahead
Stellar’s Lumen would need to move through the $0.4326 pivot to bring the first major resistance level at $0.4583 into play.
Support from the broader market would be needed, however, for Stellar’s Lumen to break back through to $0.45 levels.
Barring an extended rally, the first major resistance level and Tuesday’s high $0.4615 would likely cap any upside.
In the event of a broad-based crypto rebound, Stellar’s Lumen could test resistance at the 38.2% FIB of $0.5035. The second major resistance level sits at $0.4872.
Failure to move through the $0.4326 pivot would bring the first major support level at $0.4037 into play.
Barring another extended sell-off on the day, Stellar’s Lumen should steer clear of the second major support level at $0.3780.
A sustained fall through the 62% FIB of $0.3216 would form a near-term bearish trend from 16th May’s swing hi $0.7978.
Looking at the Technical Indicators
First Major Support Level: $0.4037
First Major Resistance Level: $0.4583
23.6% FIB Retracement Level: $0.6160
38% FIB Retracement Level: $0.5035
62% FIB Retracement Level: $0.3216
Tron’s TRX
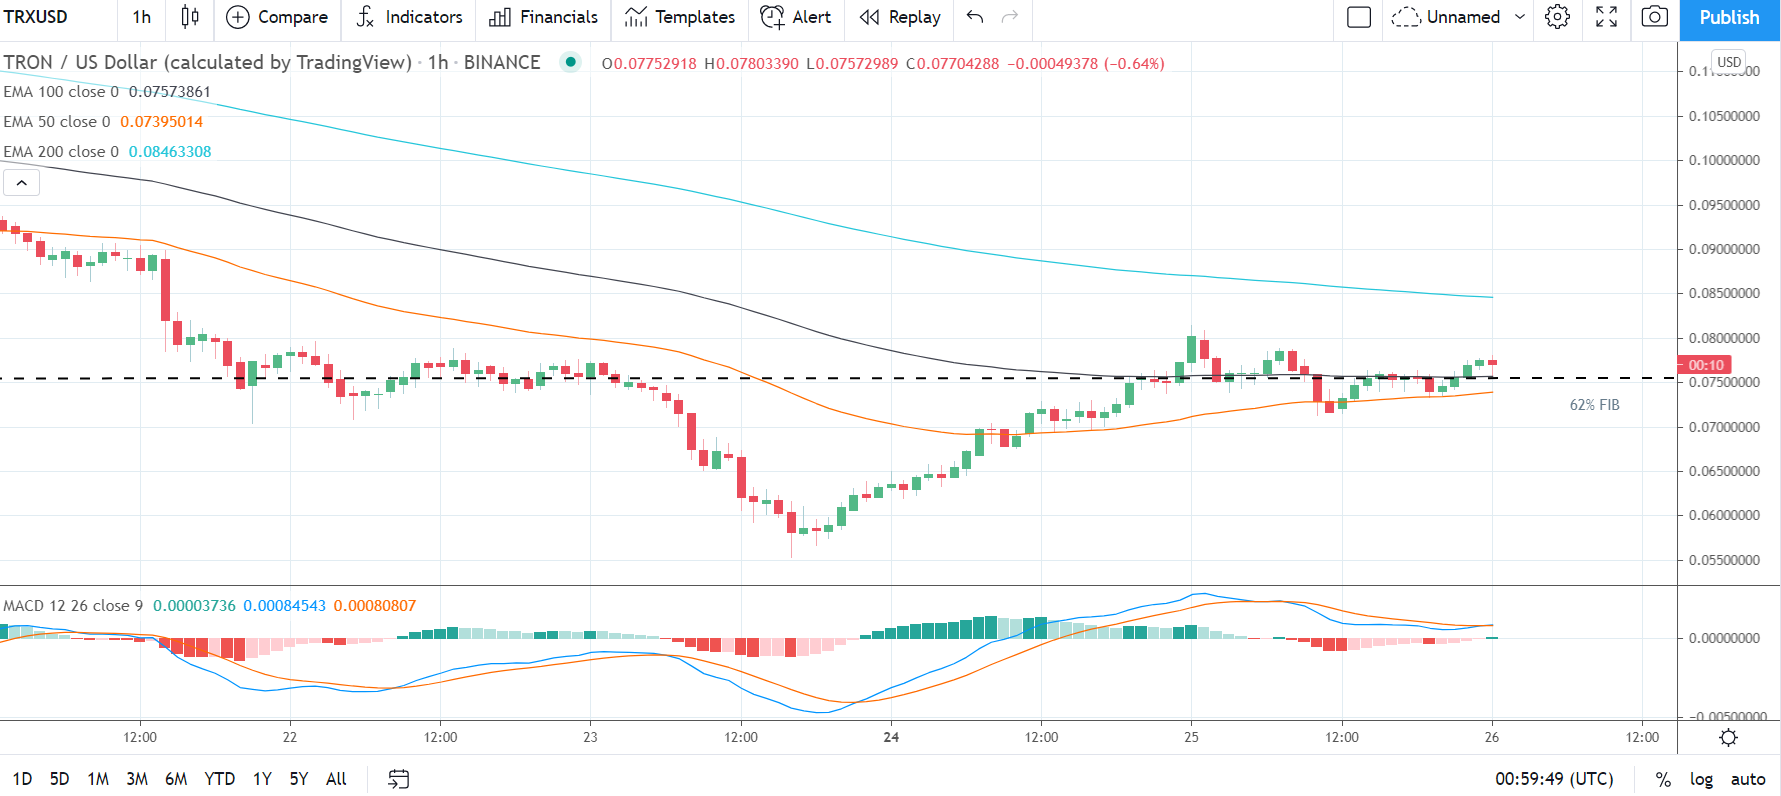
Tron’s TRX rose by 0.28% on Tuesday. Following a 22.38% rally from Monday, Tron’s TRX ended the day at $0.07754.
Tracking the broader market, Tron’s TRX rose to an early morning intraday high $0.08144 before hitting reverse.
Falling short of the first major resistance level at $0.08244, Tron’s TRX slid to a late morning intraday low $0.07130.
While steering clear of the first major support level at $0.06707, Tron’s TRX fell through the 62% FIB of $0.07480.
Finding late support, however, Tron’s TRX broke back through the 62% FIB to end the day at $0.077 levels.
At the time of writing, Tron’s TRX was down by 0.64% to $0.07704. A mixed start to the day saw Tron’s TRX rise to an early morning high $0.07803 before falling to a low $0.07573.
Tron’s TRX left the major support and resistance levels untested early on.
For the Day Ahead
Tron’s TRX would need to avoid a fall back through the pivot at $0.07676 to bring the first major resistance level at $0.08222 into play.
Support from the broader market would be needed, however, for Tron’s TRX to break out from Tuesday’s high $0.08144.
Barring an extended crypto rally, the first major resistance level would likely cap any upside.
In the event of a broad-based crypto rally, Tron’s TRX could test the second major resistance level at $0.08690.
Failure to avoid a fall back through the $0.07676 pivot would bring the 62% FIB of $0.07480 and the first major support level at $0.07208 into play.
Barring another extended sell-off, however, Tron’s TRX should steer clear of sub-$0.070 levels. The second major support level sits at $0.06662.
A sustained fall back through the 62% FIB of $0.0748 would form a near-term bearish trend from April’s swing hi $0.1844.
Looking at the Technical Indicators
First Major Support Level: $0.07208
First Major Resistance Level: $0.08222
23.6% FIB Retracement Level: $0.1426
38.2% FIB Retracement Level: $0.1167
62% FIB Retracement Level: $0.0748
Please let us know what you think in the comments below
Thanks, Bob
About the Author
Bob Masonauthor
With over 20 years of experience in the finance industry, Bob has been managing regional teams across Europe and Asia and focusing on analytics across both corporate and financial institutions. Currently he is covering developments relating to the financial markets, including currencies, commodities, alternative asset classes, and global equities.
Did you find this article useful?
Latest news and analysis


Advertisement