
Advertisement
Advertisement
Ethereum, Litecoin, and Ripple’s XRP – Daily Tech Analysis – May 27th, 2021
By:
It's a mixed start to the day for the majors. A fall through the day's pivot levels would bring support levels into play before any recovery.

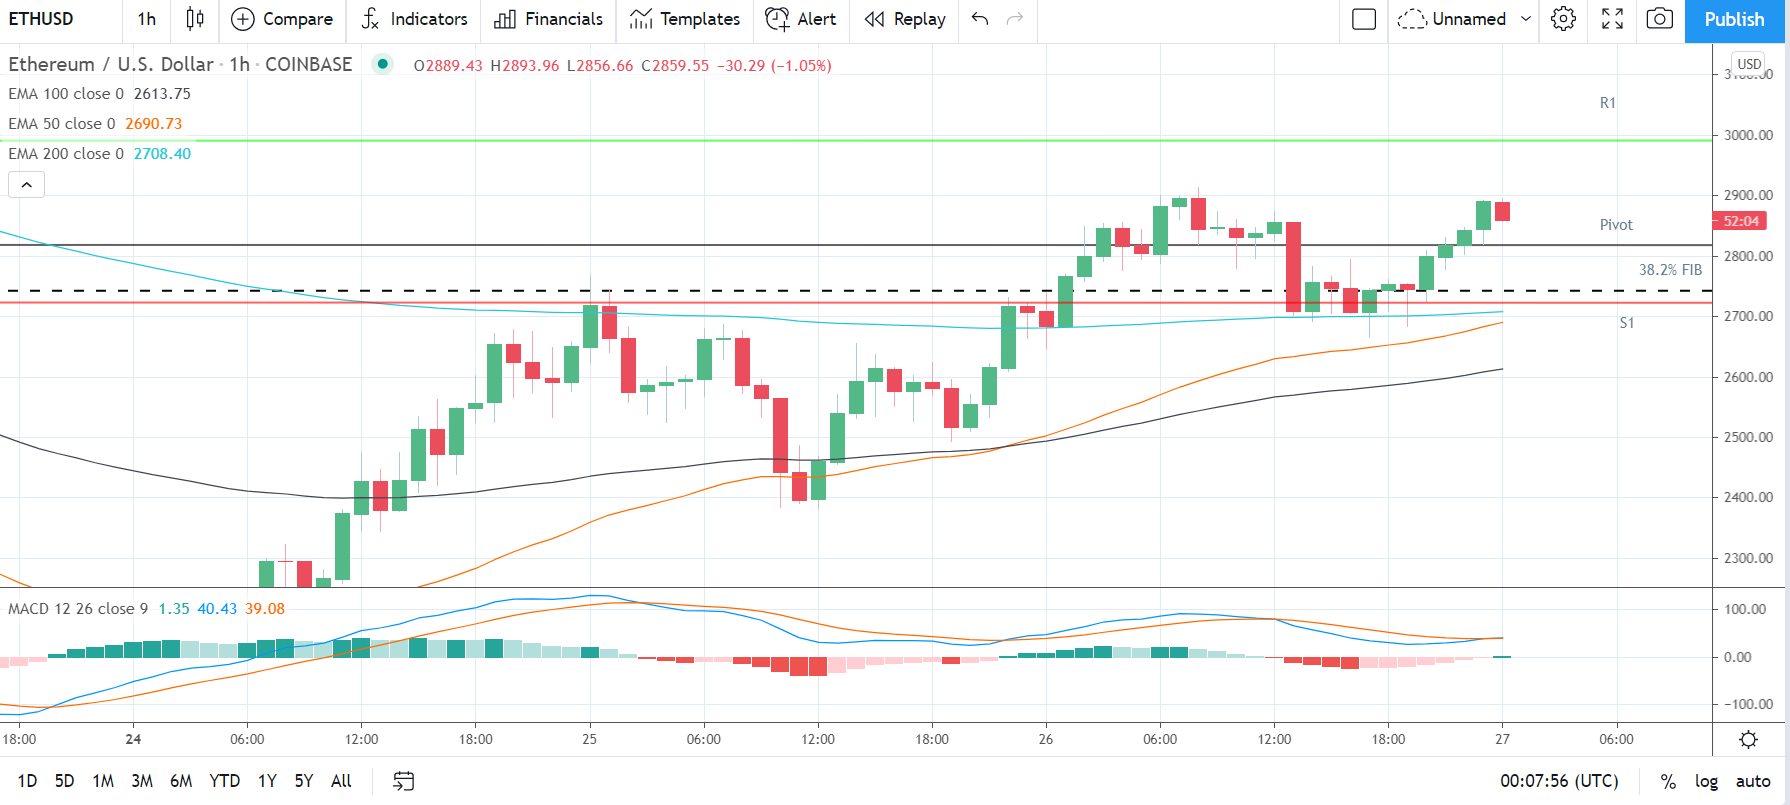
Ethereum
Ethereum rose by 6.72% on Wednesday. Following a 2.20% gain on Tuesday, Ethereum ended the day at $2,889.84.
A bearish start to the day saw Ethereum fall to an early morning intraday low $2,647.21 before making a move.
Steering clear of the first major support level at $2,471, Ethereum rose to a late morning intraday high $2,913.68.
Ethereum broke through the 38.2% FIB of $2,740 and the first major resistance level at $2,856.
An early afternoon pullback saw Ethereum fall back through the first major resistance level and the 38.2% FIB to sub-$2,700 levels.
Finding late support, however, Ethereum moved back through to $2,800 levels to deliver the upside on the day.
Ethereum broke back through the 38.2% FIB of $2,740 and the first major resistance level at $2,856 in the late rebound.
At the time of writing, Ethereum was down by 1.05% to $2,859.55. A mixed start to the day saw Ethereum rise to an early morning high $2,893.96 before falling to a low $2,856.66.
Ethereum left the major support and resistance levels untested early on.
For the day ahead
Ethereum would need to avoid the $2,817 pivot to bring the first major resistance level at $2,987 into play.
Support from the broader market would be needed, however, for Ethereum to break back through to $2,900 levels.
Barring an extended crypto rally, the first major resistance level and resistance at $3,000 would likely cap any upside.
In the event of a broad-based crypto rally, Ethereum could test resistance at the 23.6% FIB of $3,369. The second major resistance level sits at $3,083.
Failure to avoid the $2,817 pivot would bring the first major support level at $2,720 into play.
Barring an extended sell-off, however, Ethereum should steer clear of sub-$2,600 levels. The second major support level sits at $2,550.
A sustained fall through the 62% FIB of $1,725 would form a near-term bearish trend from 12th May’s swing hi $4,384.30.
Looking at the Technical Indicators
First Major Support Level: $2,720
Pivot Level: $2,817
First Major Resistance Level: $2,987
23.6% FIB Retracement Level: $3,369
38.2% FIB Retracement Level: $2,740
62% FIB Retracement Level: $1,725
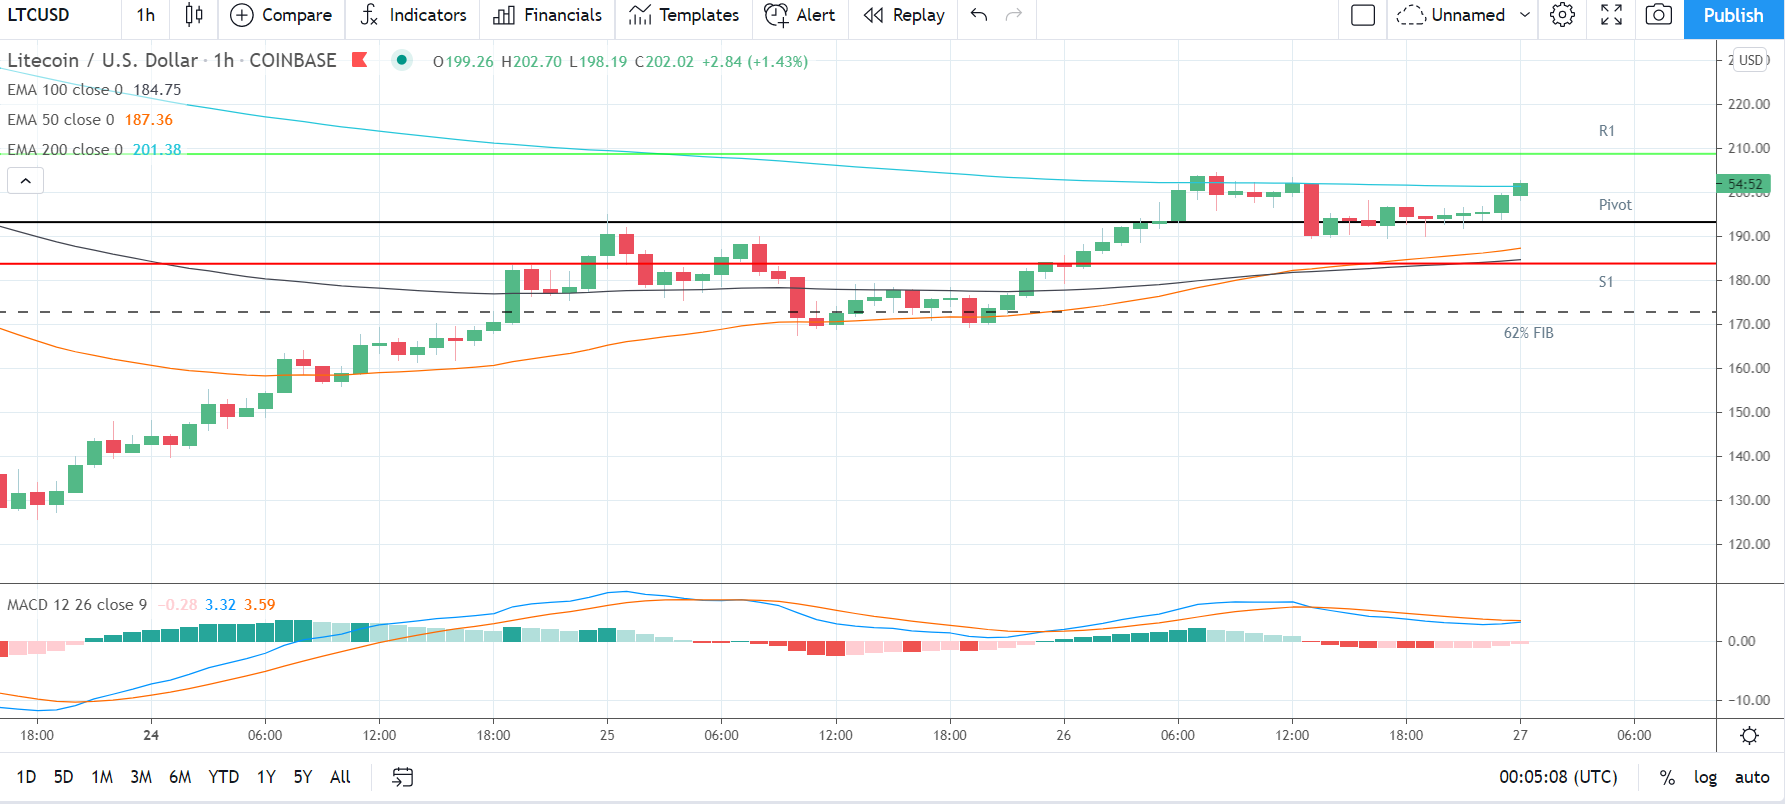
Litecoin
Litecoin rallied by 8.28% on Wednesday. Reversing a 0.75% loss from Tuesday, Litecoin ended the day at $199.18.
A mixed start to the day saw Litecoin fall to an early morning intraday low $179.39 before finding support.
Steering clear of the 62% FIB of $174 and the first major support level at $169, Litecoin rose to a late morning intraday high $204.48.
Litecoin broke through the first major resistance level at $197 to test resistance at $200 before easing back.
The pullback saw Litecoin fall back through the first major resistance level to sub-$195 levels.
Finding late support, however, Litecoin broke back through the first major resistance level to end the day at $199 levels.
At the time of writing, Litecoin was up by 1.43% to $202.02. A mixed start to the day saw Litecoin fall to an early morning low $198.19 before rising to a high $202.70.
Litecoin left the major support and resistance levels untested early on.
For the day ahead
Litecoin would need to avoid a fall through the $194 pivot to bring the first major resistance level at $209 into play.
Support from the broader market would be needed, however, for Litecoin to break out from Wednesday’s high $204.48.
Barring an extended crypto rally, the first major resistance level and resistance at $210 would likely cap any upside.
In the event of an extended breakout, Litecoin could test resistance at $230. The second major resistance level sits at $219.
Failure to avoid a fall through the $194 pivot would bring the first major support level at $184 into play.
Barring an extended sell-off, however, Litecoin should steer clear of the 62% FIB of $174. The second major support level sits at $169.
A sustained fall through the 62% FIB of $174 would form a near-term bearish trend from 10th May’s swing hi $413.91.
Looking at the Technical Indicators
First Major Support Level: $184
Pivot Level: $194
First Major Resistance Level: $209
23.6% FIB Retracement Level: $322
38.2% FIB Retracement Level: $265
62% FIB Retracement Level: $174
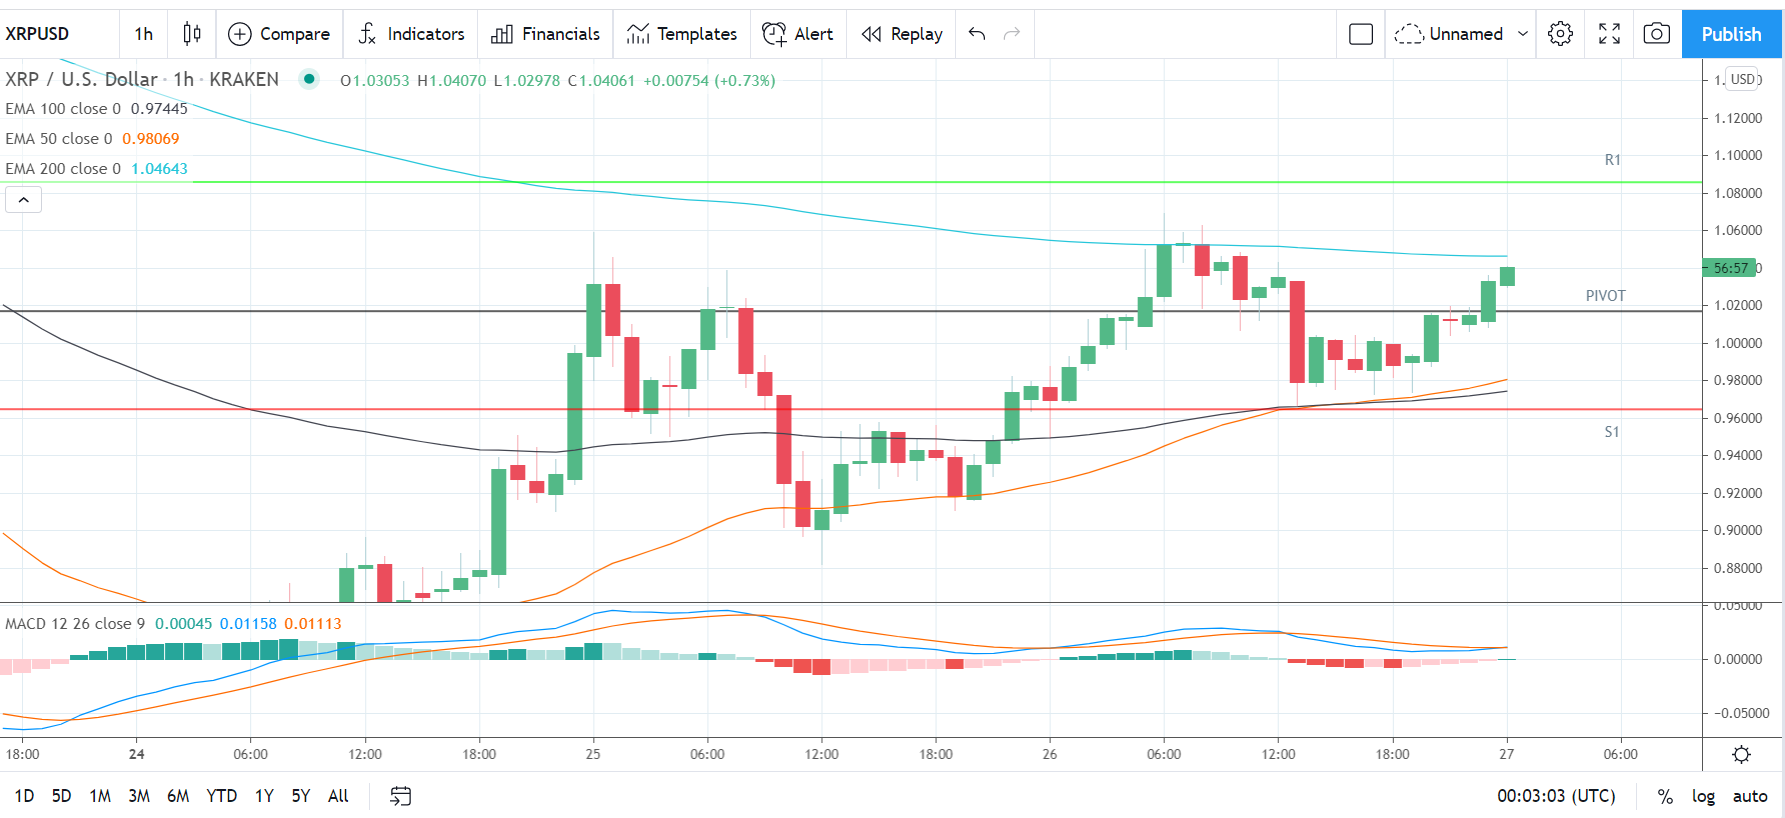
Ripple’s XRP
Ripple’s XRP rose by 5.83% on Wednesday. Reversing a 1.60% decline from Tuesday, Ripple’s XRP ended the day at $1.03307.
A mixed start to the day saw Ripple’s XRP fall to an early morning intraday low $0.94910 before making a move.
Steering clear of the first major support level at $0.8863, Ripple’s XRP rose to a mid-morning intraday high $1.06941.
Coming up against the first major resistance level at $1.0633, Ripple’s XRP fell back to sub-$0.97 levels and into the red.
A late move back through to $1.03 levels delivered the upside on the day, however.
At the time of writing, Ripple’s XRP was up by 0.73% to $1.04061. A mixed start to the day saw Ripple’s XRP fall to an early morning low $1.02978 before rising to a high $1.04070.
Ripple’s XRP left the major support and resistance levels untested early on.
For the day ahead
Ripple’s XRP will need to avoid a fall through the $1.0172 pivot to bring the first major resistance level at $1.0853 into play.
Support from the broader market would be needed, however, for Ripple’s XRP to break out from Wednesday’s high $1.06941.
Barring an extended crypto rally, the first major resistance level and resistance at $1.10 would likely cap any upside.
In the event of an extended rally, Ripple’s XRP could test resistance at $1.20. The second major resistance level sits at $1.1375.
Failure to avoid a fall through the $1.0172 pivot would bring the first major support level at $0.9650 into play.
Barring another extended sell-off, however, Ripple’s XRP should steer clear of sub-$0.90 levels. The second major support level sits at $0.8969.
A sustained fall through the 62% FIB would form a near-term bearish trend from 14th April’s swing hi $1.96598.
Looking at the Technical Indicators
First Major Support Level: $0.0.9650
Pivot Level: $1.0172
First Major resistance Level: $1.0853
23.6% FIB Retracement Level: $1.5426
38.2% FIB Retracement Level: $1.2807
62% FIB Retracement Level: $0.8573
Please let us know what you think in the comments below.
Thanks, Bob
About the Author
Bob Masonauthor
With over 20 years of experience in the finance industry, Bob has been managing regional teams across Europe and Asia and focusing on analytics across both corporate and financial institutions. Currently he is covering developments relating to the financial markets, including currencies, commodities, alternative asset classes, and global equities.
Did you find this article useful?
Latest news and analysis


Advertisement